

Misc
Mapped: How the Energy Crisis Impacts Global Food Insecurity
Mapped: How the Energy Crisis Impacts Global Food Insecurity
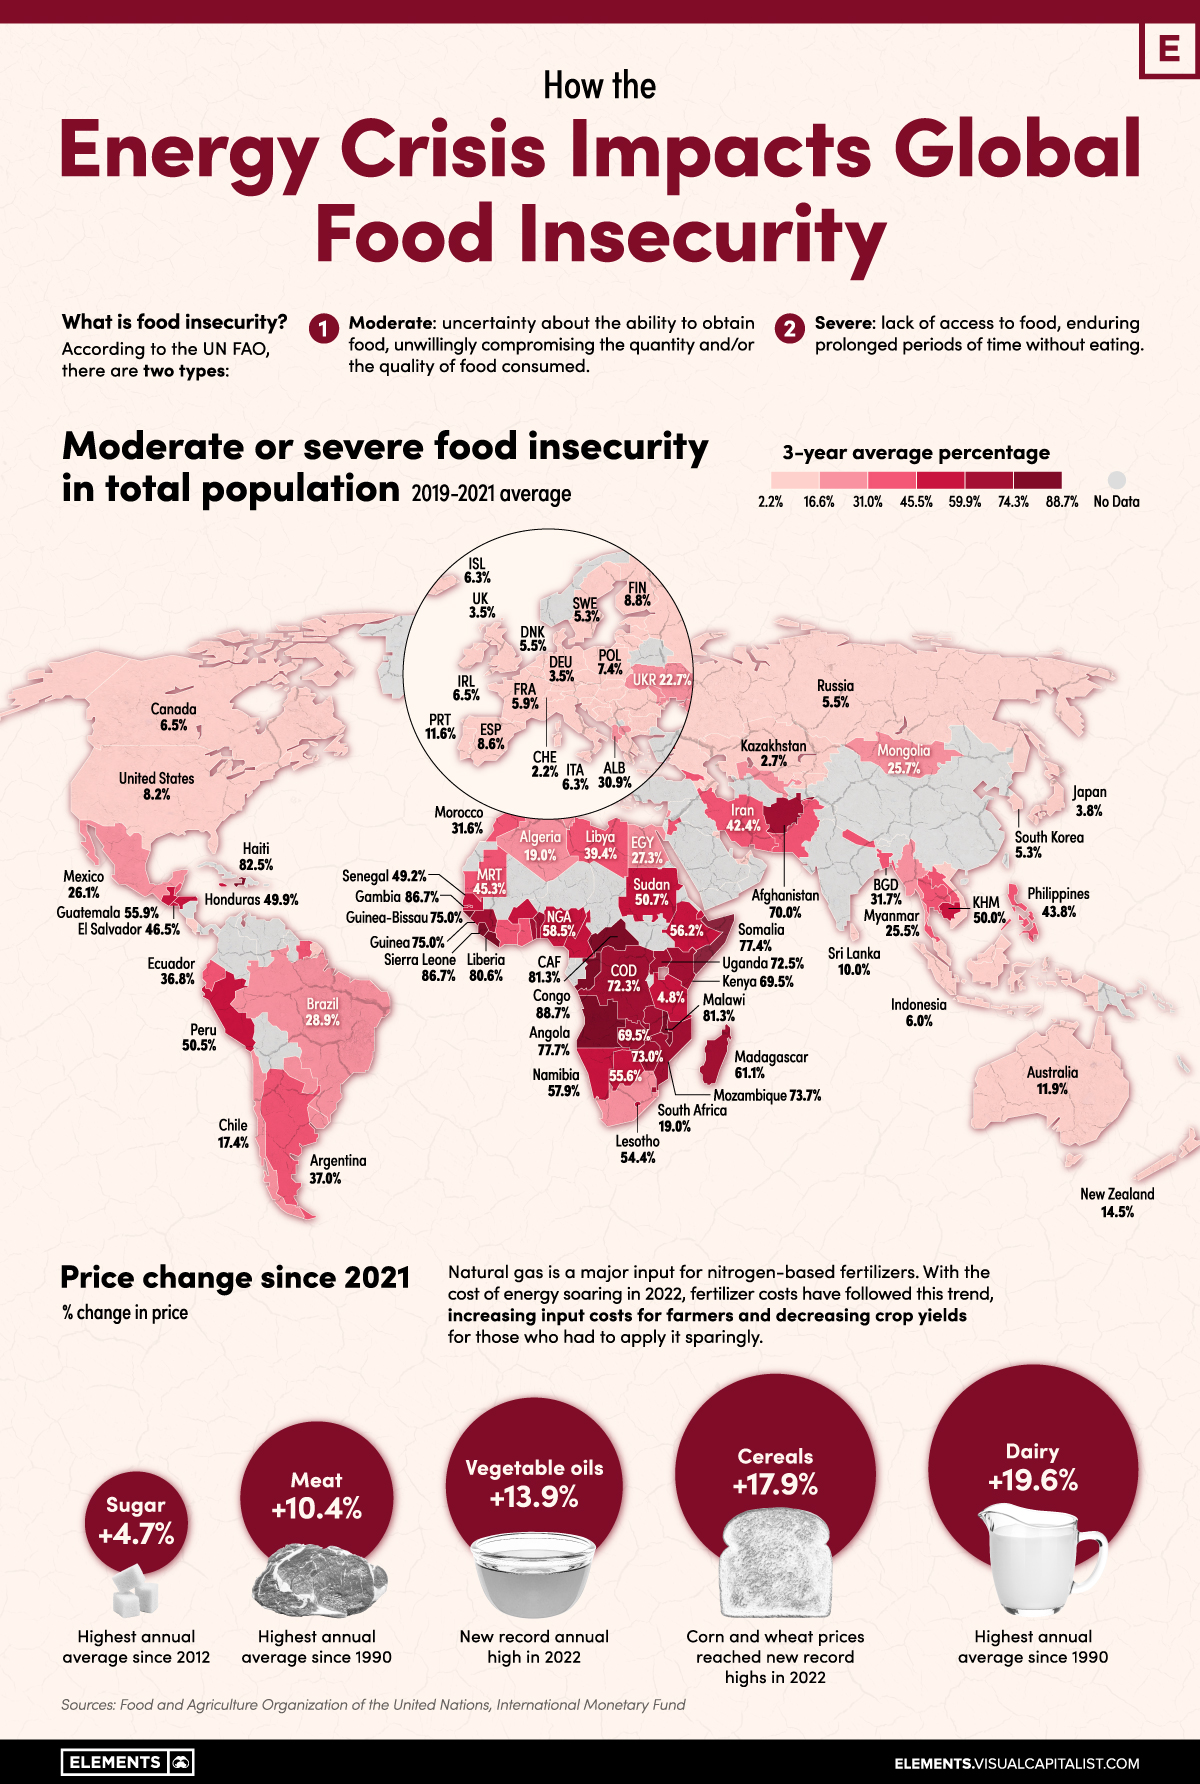
Food insecurity occurs when an individual does not have access to the adequate quantity or quality of food they require to meet their biological needs.
A disruption in supply chains, rising input costs, and inadequate weather can all have a direct impact on global food security, all of which have been in play in recent years.
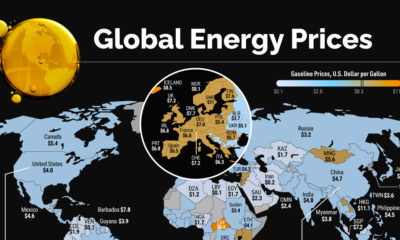
Using data from the Food and Agriculture Organization (FAO) of the United Nations, let’s do a deep dive into food insecurity around the world and discuss how rising energy costs can drive up food prices, exacerbating food insecurity.
The State of Global Food Insecurity
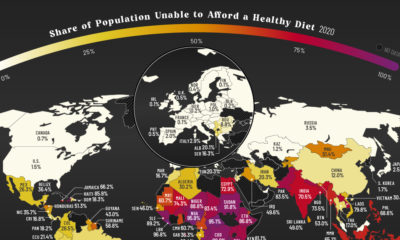
The latest data from the FAO marks 29.3% of the entire world population to be moderately or severely food insecure, with 40% of this population experiencing severe food insecurity. Based on FAO definitions, here is what that means:
- A moderately food insecure person experiences uncertainty about their ability to obtain food, unwillingly compromising the quantity and/or the quality of food they consume
- A severely food insecure person lacks access to food, enduring prolonged periods of time without eating
The African continent bears most of the burden when it comes to global food insecurity, with 14 out of the top 15 most food-insecure countries being in this region. The data also paints a relatively grim picture for Middle Eastern and South American countries, while North America and Western Europe have moderate or severe food insecurity marked below 10%.
| Country | Prevalence of moderate or severe food insecurity (3-year average, 2019-2021) |
|---|---|
| 🇨🇬 Congo | 88.7% |
| 🇸🇱 Sierra Leone | 86.7% |
| 🇸🇸 South Sudan | 86.4% |
| 🇭🇹 Haiti | 82.5% |
| 🇨🇫 Central African Republic | 81.3% |
| 🇲🇼 Malawi | 81.3% |
| 🇱🇷 Liberia | 80.6% |
It’s difficult to pinpoint the prevalence of African food insecurity to just one cause. Climate change, conflict in Africa, government debt, and Russia’s invasion of Ukraine have all contributed in different ways to worsening food security conditions in this region.
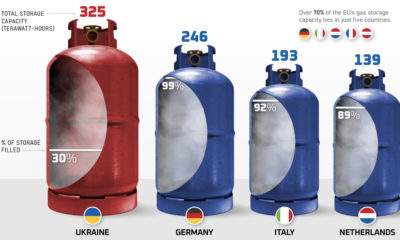
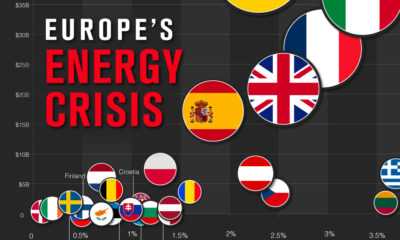
The Russia-Ukraine conflict, for instance, led to European aid for African countries to drop substantially, while grain exports from both Ukraine and Russia fell as ports in the Black Sea experienced disruptions. The war has also caused a disruption in fertilizer supplies, with Russia being the top exporter of fertilizer, along with a substantial rise in farming input costs as energy prices soared in 2022.
How Energy Prices Trickle Down to Food Prices
Food prices have risen substantially in the last year due to surging energy prices and supply chain disruptions. The FAO food price index, which measures the change in international prices of a basket of food commodities, saw a 14.3% increase between 2021 and 2022.
| Index | % change in price since 2021 |
|---|---|
| General Food Price Index | 14.3% |
| Meat | 10.4% |
| Dairy | 19.6% |
| Cereals | 17.9% |
| Vegetable oils | 13.9% |
| Sugar | 4.7% |
As seen above, individual commodity indices followed this trend, with dairy and cereal prices bearing the brunt.
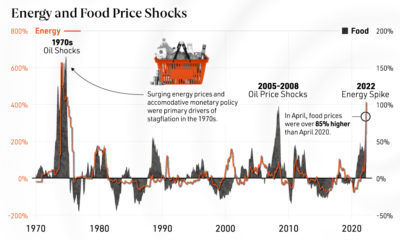
Energy costs trickle down to food prices in a variety of ways. The simple correlation between historic oil and corn prices, seen below, can paint a telling picture.
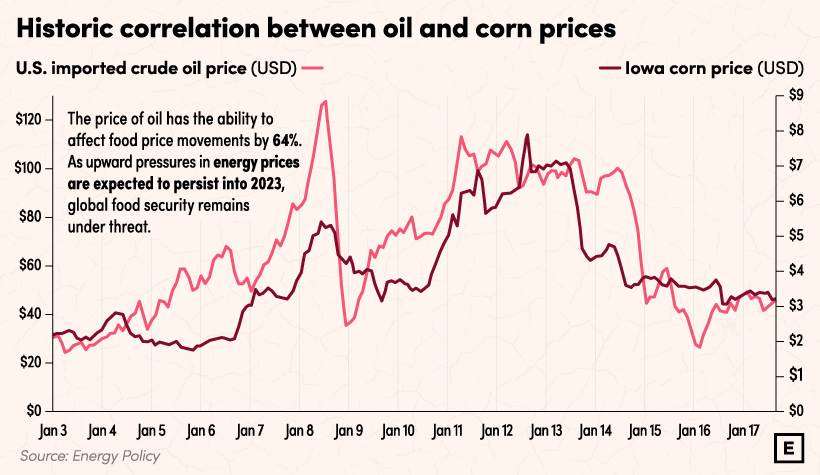
What’s interesting is that the International Monetary Fund (IMF) predicts that the effects of the 2022 energy cost crisis may not have even fully materialized yet.
According to their research, a 1% increase in fertilizer prices can boost food commodity prices by 0.45% within four quarters. With natural gas, a major input for nitrogen-based fertilizer, being 150% more expensive in 2022 than in 2021, this may be a cause for concern in the upcoming months.
Relatedly, a rise in fertilizer costs is also connected to harvest levels in upcoming seasons. Reduced use of fertilizer as a result of high costs can lead to diminished crop yields, and the IMF predicts that a 1% drop in global harvests bumps food commodity prices by 8.5%, potentially indicating that the worst of it for food prices—and for global food security—is still yet to come.
Looking Ahead to 2023
Food security is a fundamental aspect of human existence and plays an important role in the steady economic growth and prosperity of nations. While we may be tempted to believe that we’re heading in the right direction on a global scale, the FAO paints a different picture, specifically for Africa.
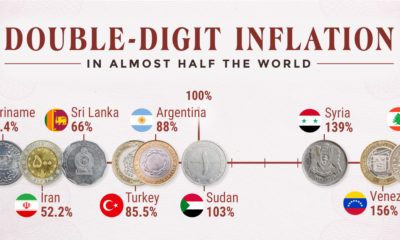
2030 predictions for global undernourishment forecast an 11.5% increase in hunger in Africa, while world hunger at large is predicted to decrease. With global inflation looming high and food prices still under the influence of 2022 events, addressing hunger in Africa is as crucial as ever to improve the overall well-being and development of the continent.


Misc
Visualizing Global Aluminum Production
China dominates global production with nearly 60% share.
Visualizing Global Aluminum Production
This was originally posted on our Voronoi app. Download the app for free on iOS or Android and discover incredible data-driven charts from a variety of trusted sources.
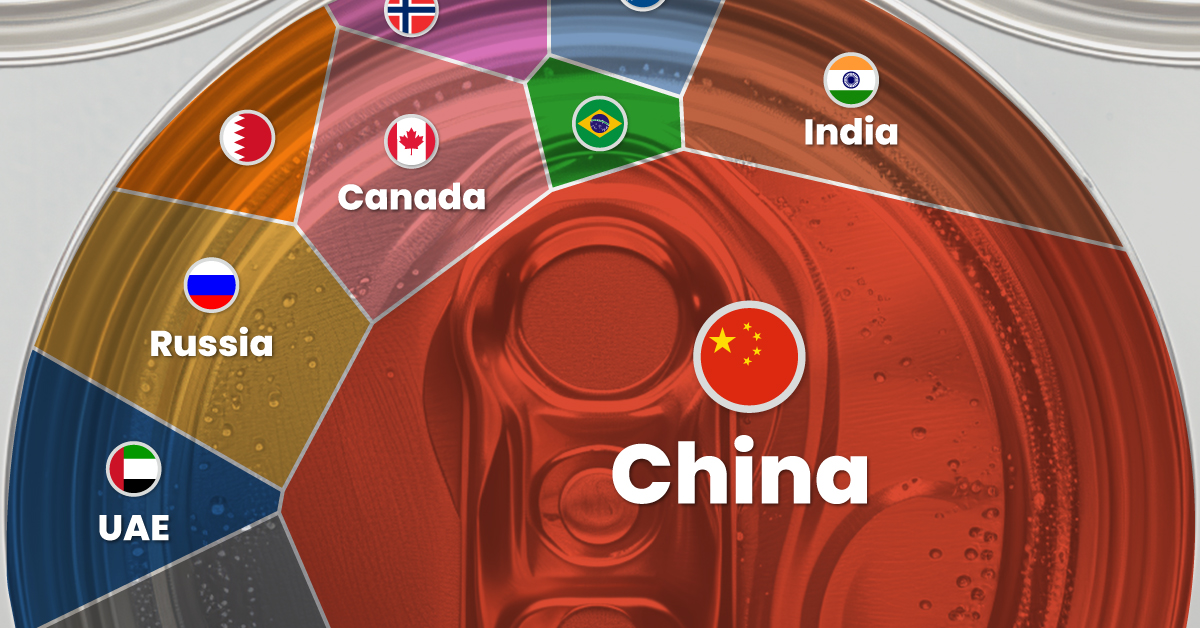
This infographic shows estimated aluminum smelter production by country in 2023, based on data from the most recent U.S. Geological Survey (USGS) Mineral Commodity Summaries, published in January 2024 .
From this data, we can see that China leads as the top producer, accounting for nearly 60% of the world’s smelter capacity. Its neighbor India is the second-largest producer, making only a tenth of China’s output.
| Country | 2023 Aluminum Smelter Production (tonnes) | % of total |
|---|---|---|
| 🇨🇳 China | 41,000,000 | 59% |
| 🇮🇳 India | 4,100,000 | 6% |
| 🇷🇺 Russia | 3,800,000 | 5% |
| 🇨🇦 Canada | 3,000,000 | 4% |
| 🇦🇪 United Arab Emirates | 2,700,000 | 4% |
| 🇧🇭 Bahrain | 1,600,000 | 2% |
| 🇦🇺 Australia | 1,500,000 | 2% |
| 🇳🇴 Norway | 1,300,000 | 2% |
| 🇧🇷 Brazil | 1,100,000 | 2% |
| 🌍 Rest of the World | 9,460,000 | 14% |
| Total | 69,560,000 | 100% |
Responsible for 5% of global aluminum output, Russia has been targeted by recent sanctions from the U.S. and the UK.
The sanctions include prohibiting metal-trading exchanges from accepting new aluminum produced by Russia and barring the import of the Russian metal into the U.S. and Britain. The actions are aimed at disrupting Russian export revenue amid Moscow’s ongoing invasion of Ukraine.
The World’s Most Common Metal
Aluminum is the primary material used for making cans, foil, and many other products. It originates from bauxites, rocks composed of aluminum oxides, and various minerals.
Approximately 25% of annually produced aluminum is utilized by the construction industry, while another 23% is allocated to vehicle frames, wires, wheels, and other components within the transportation sector. Aluminum foil, cans, and packaging constitute another significant end-use category, accounting for 17% of consumption.
Despite its extensive use, aluminum is still plentiful. Aluminum is the world’s most common metal by crustal abundance, making up 8.2% of the Earth’s crust.
According to the USGS, global resources of bauxite are estimated to be between 55 billion and 75 billion tonnes and are sufficient to meet world demand for metal well into the future.
Misc
Brass Rods: The Sustainable Choice
Brass rods can help cut emissions in machine shops, be recycled without losing properties, and contribute to a cleaner environment.

Brass Rods: The Sustainable Choice
Brass rods have a powerful lineup of green attributes, making them the sustainable choice for manufacturers and end-users of precision machined and forged parts.
This infographic, from the Copper Development Association, shows how brass rods can reduce emissions in machine shops, be recycled without losing properties, and contribute to a cleaner environment.
The Brass Rod Circular Economy
The metallurgical properties of brass allow pre- and post-consumer sources of brass scrap to be recycled with no loss in properties.
Brass scrap can retain over 90% of the original material value. In addition, brass doesn’t need energy-intensive processing, unlike steel and aluminum, which must be smelted and refined before being recycled into new products.
As a result, there is a greater chance that steel and aluminum scrap will end up in landfills.
Most brass-rod alloys produced in North America contain 95% or higher recycled content.
Closed-loop recycling of brass keeps this valuable engineering material out of landfills, reducing the need for new mines and all the environmental impacts that entails.
Higher Machinability Leads to Lower Operational Carbon Emissions
Machinability is how easily a material can be worked using cutting processes. It directly impacts the amount of energy required to produce finished parts.
With typical machine shops producing millions of parts each year, the carbon impact can be significant.
Here’s how brass and steel compare when manufacturing complex parts using computer numerical control (CNC) machining.
| Material | Brass | Steel |
|---|---|---|
| Type | Free-cutting brass (C36000) | Free-cutting steel (12L14) |
| Maximum machinability rating (0-100) | 100 | 21 |
| Metal Removal Rate (cubic inches per minute) | 0.238 | 0.114 |
| Time to remove material (hours) | 161,111 | 336,111 |
| Energy required to produce parts (kilowatt-hour) | 9,475 | 18,931 |
In this example, using brass represented a savings of 3,510 kg in carbon dioxide (CO2).
The significantly longer tool life enabled by brass also reduces the need for new cutting tools, further decreasing emissions.
High recycled content and exceptional machinability make brass rods the sustainable choice for manufacturers and end-users seeking to reduce their environmental footprint and support the transition to a low-carbon future.
Explore the advantages of brass rod solutions.

-

 Electrification3 years ago
Ranked: The Top 10 EV Battery Manufacturers
-

 Electrification2 years ago
The Key Minerals in an EV Battery
-

 Real Assets3 years ago
The World’s Top 10 Gold Mining Companies
-

 Electrification3 years ago
Mapped: Solar Power by Country in 2021
-

 Misc3 years ago
All the Metals We Mined in One Visualization
-

 Energy Shift2 years ago
What Are the Five Major Types of Renewable Energy?
-

 Electrification2 years ago
The World’s Largest Nickel Mining Companies
-

 Misc3 years ago
The Largest Copper Mines in the World by Capacity