A family tree diagram is a simple chart that helps you track and document your ancestry. It visualizes your lineage and traces relationships back to common ancestors.
You can create a family tree that goes back to your ancestors, such as great grandparents or grandparents, or you can draw one to show your children and any grandchildren. Some family diagrams show both ancestors and descendants.
The goal of this chart is to record the important people and events in your family’s history. It can be a fun activity that brings your whole family together to reminisce and share stories.
This article will cover the basics of a family diagram, the different types, its benefits, and how to create one online. We’ll also delve into organizational charts and other diagrams that borrow from the family tree structure but are used for different work processes.
Try Miro’s Family Tree Diagram Template
What is a family tree diagram?
A family tree diagram illustrates an individual’s ancestry. It showcases the different relationships between generations of a particular family.
You can use a family tree to trace your lineage, aka your parents, grandparents, etc., or show your descendants, including children and grandchildren.
As the name suggests, it can be structured like a tree with one individual as the root. Branches or lines are drawn to represent relationships. Each branch will have leaves representing family members.
Your family tree diagram can be as detailed as possible, or it can simply be a basic diagram with a flowchart-like structure. Typically, each leaf in the tree will have details like name, birth dates, marriage, and death dates.
A family tree is also often referred to as a genealogy chart. Some confuse a family tree with a pedigree chart. But, a pedigree diagram is a slightly different chart that outlines genetic traits rather than family relationships.
A family tree can help children learn more about their family, beyond just their parents and siblings, in an exciting way. They can also be used for discussions related to inheritance.
You can create a family tree to track all the descendants or ancestors of a specific person or to track everyone with the same surname. They also make for great history projects to track a dynasty, such as the British royal family.
Family trees have also been adopted into businesses to show organizational or team hierarchy or to create strategic diagrams.
A similar tool, called an organizational chart, is used in business. It has a similar structure to the family tree but is used to showcase the employee hierarchy within a company.
The benefits of a family tree diagram
A family tree diagram is a great learning experience and a fun activity at the same time.
Here’s why you should create a family tree:
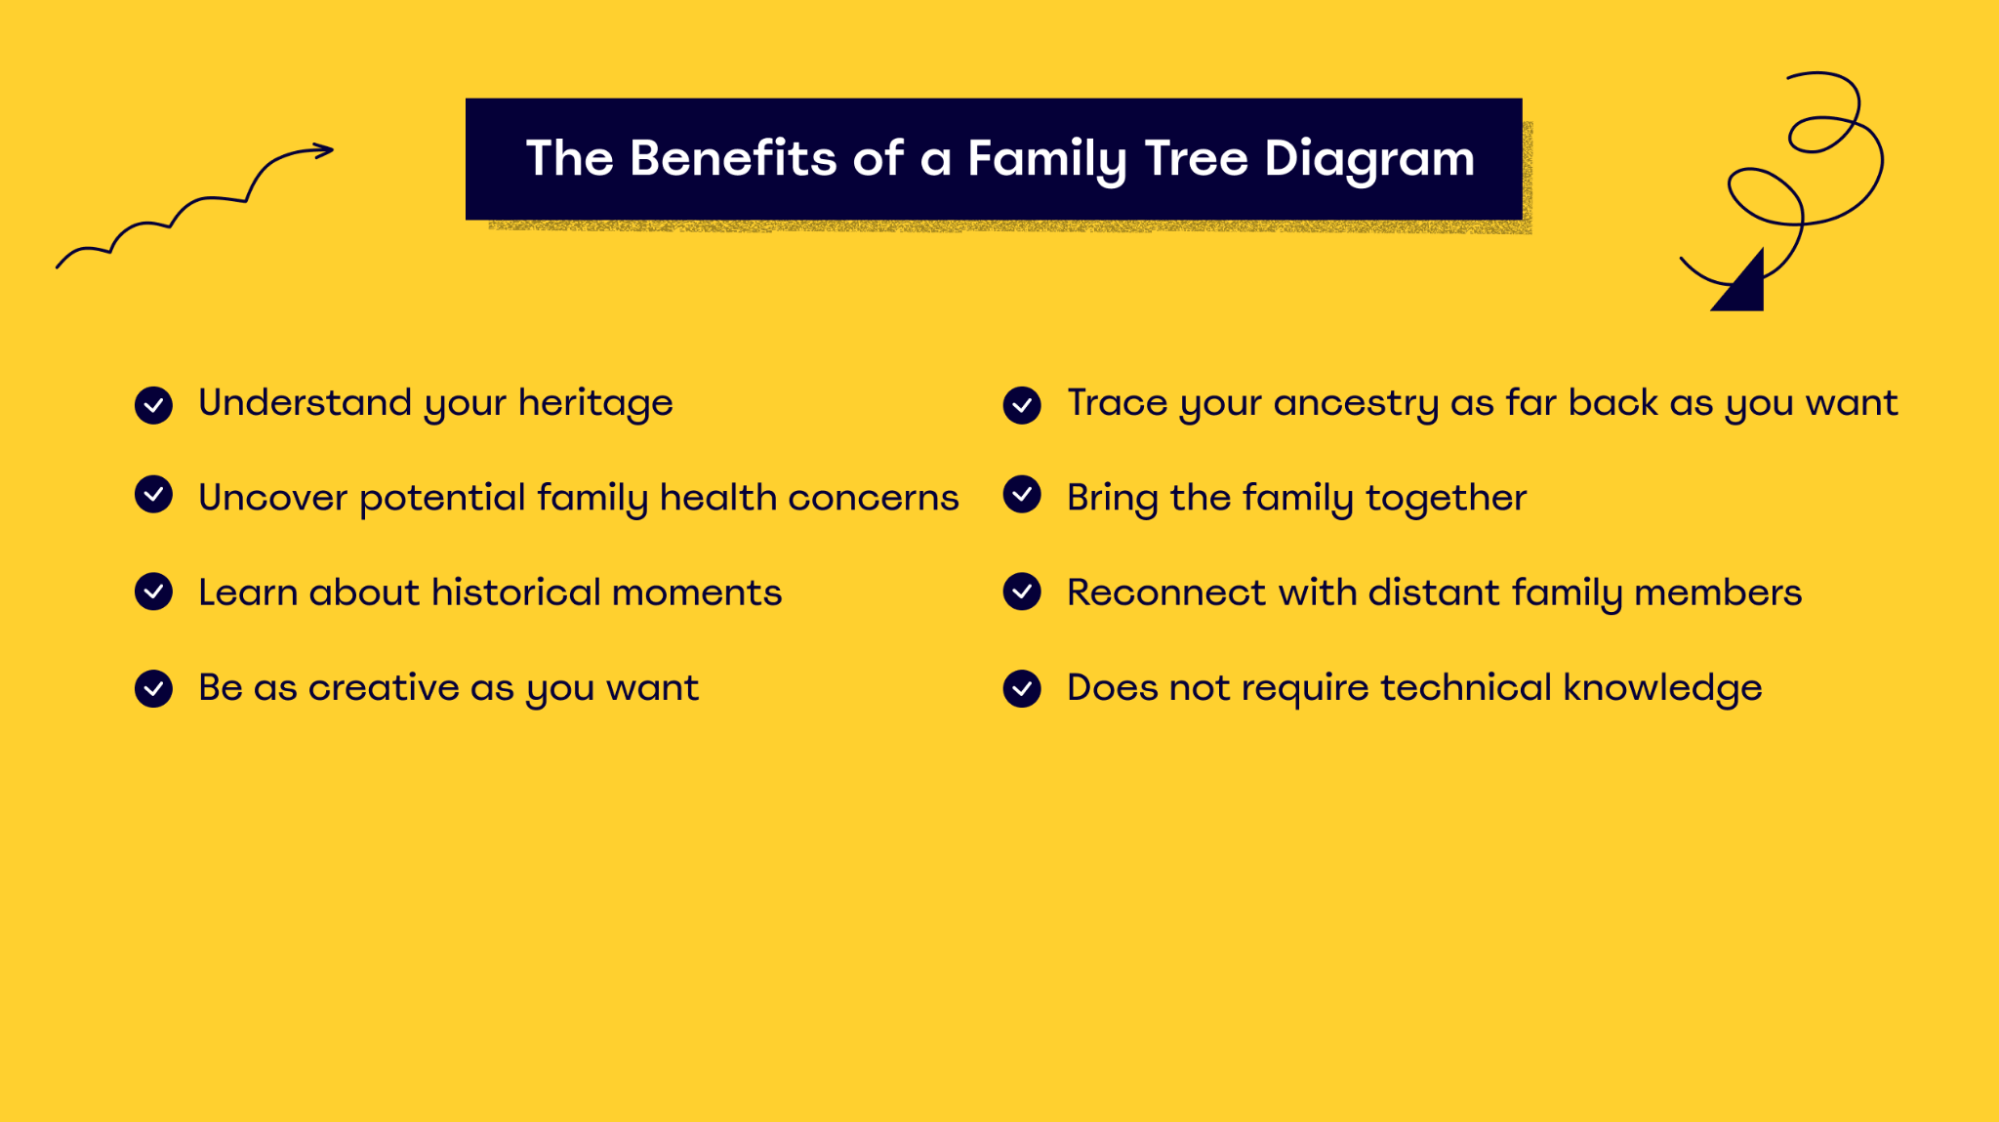
Understand your heritage
A family tree is an engaging and fun way for adults and children to learn about their relatives. It can help you understand your roots and how you connect to the world.
Children benefit from a family tree chart since it shows them relatives that they don’t see regularly. It helps them see beyond their day-to-day lives and understand their place in a family structure.
Uncover any potential family health concerns
Many diseases can be passed on genetically, and your family could have a hereditary health issue that you’re unaware of.
With a family tree, you can trace genetics and discover any potential hereditary health concerns. Identifying these concerns early could lead to early treatment and a better prognosis.
Learn about historical moments and interesting stories
Stories about relatives, especially distant ones, tend to be forgotten over time. Creating a family tree is the perfect opportunity to learn about interesting stories, historical achievements, and entertaining family anecdotes.
Maybe your great grandfather had an epic war story, or your grandmother has a funny anecdote about one of her children. Whatever it is, a family tree gives you the chance to record and relive unforgettable moments.
Customize your family tree however you want
You can unleash your creativity while creating a family tree, especially if you’re creating one with your child. Add as many colors as you’d like, and use funky shapes to make the process entertaining and the final chart mesmerizing.
Trace your ancestry as far back as you want
You can use a family chart as a personal passion project to learn about your distant ancestors. In the process, you end up learning more about your family via research and talking to older generations. This then creates a better connection with your relatives — both alive and dead.
You can create a tree that goes further back before even your great grandparents, and who knows — maybe you’ll uncover a long-lost secret or find surprising connections to well-known historical icons.
Bring the family together
Apart from being a great personal project, a family tree can also be a fun group project that brings the whole family together.
You can ask your children for help creating it. Or, everyone in the family can come together to contribute to the creation of an online family tree with their own research and stories.
You can also have a big family reunion to showcase the finished tree, talk about stories, and reminisce.
Reconnect with distant family members
A collaborative family tree gives you a perfect chance to reconnect with distant family members. Maybe there’s an aunt you haven’t spoken to in years or a cousin who you haven’t seen since you were a child.
When creating your tree, you can reach out to these relatives and rebuild your relationship with them.
Map your lineage without any technical knowledge
You don’t need any technical expertise to make a family tree. Even the most technologically averse individual can draw a tree and some branches to create the chart.
The different types of family tree diagrams
There are five common types of family trees:
- Ancestral chart: An ancestral family tree shows an individual’s ancestors.
- Descendants chart: This type shows the descendants of an individual. There are two people at the top (the parents), followed by all their children and grandchildren.
- Sandglass diagram: This shows a person’s ancestors and descendants. Typically, the individual is at the center with the ancestors on top and descendants below.
- Timeline chart: This type is used to see which family members’ lives overlapped. Bars represent each person’s life span.
- Waterfall chart: This is a version of the descendant’s chart that shows them cascading from top left to the bottom right of the screen/paper.
There is no ideal family tree type. Depending on your project and the purpose of the tree, you can choose any type we’ve mentioned above and customize them as needed.
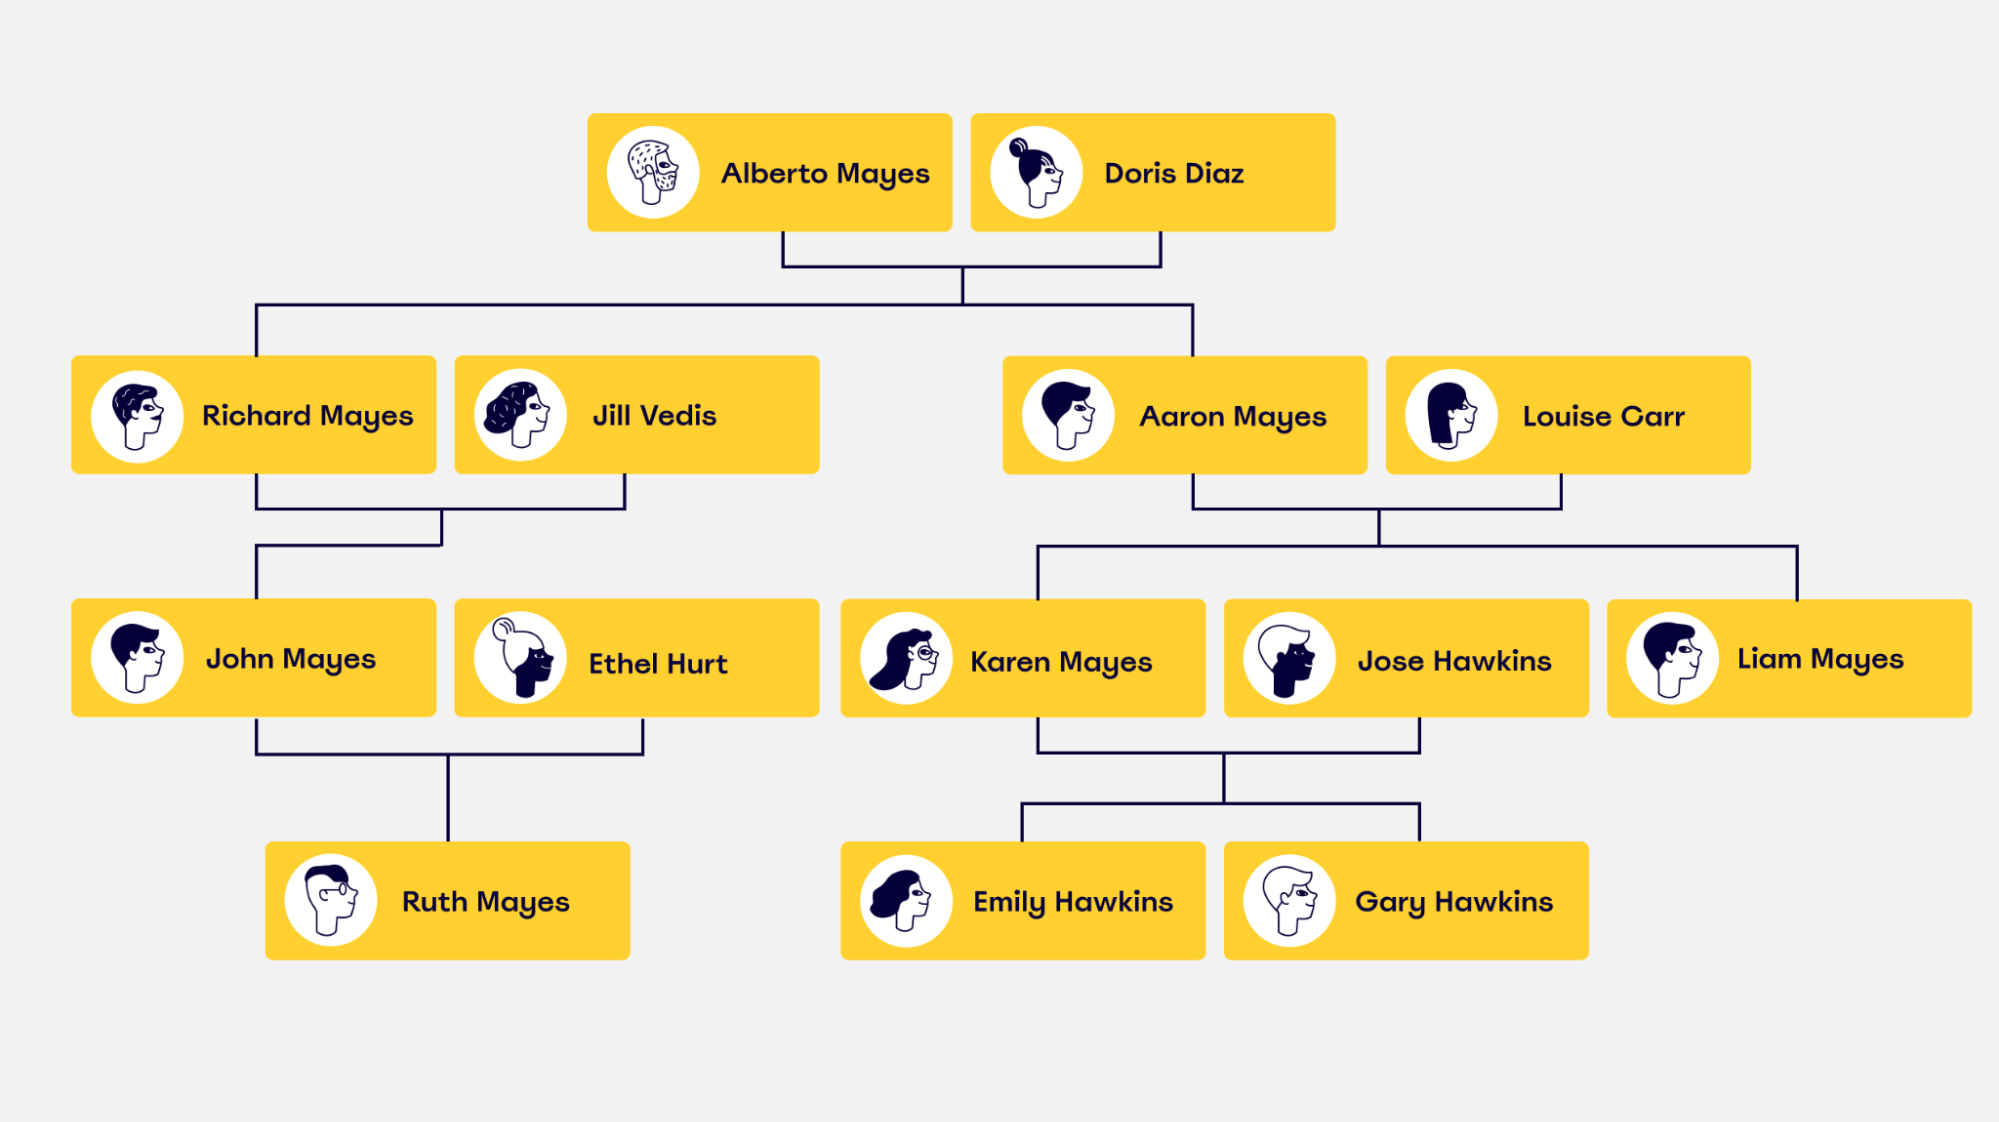
Example of a family tree diagram
A typical family tree diagram can proceed from left to right or top to bottom.
Most family tree charts are used to trace ancestors. In a top-down ancestral chart, the main ancestor is at the top of the diagram, and their children and grandchildren branch off of them toward the bottom.
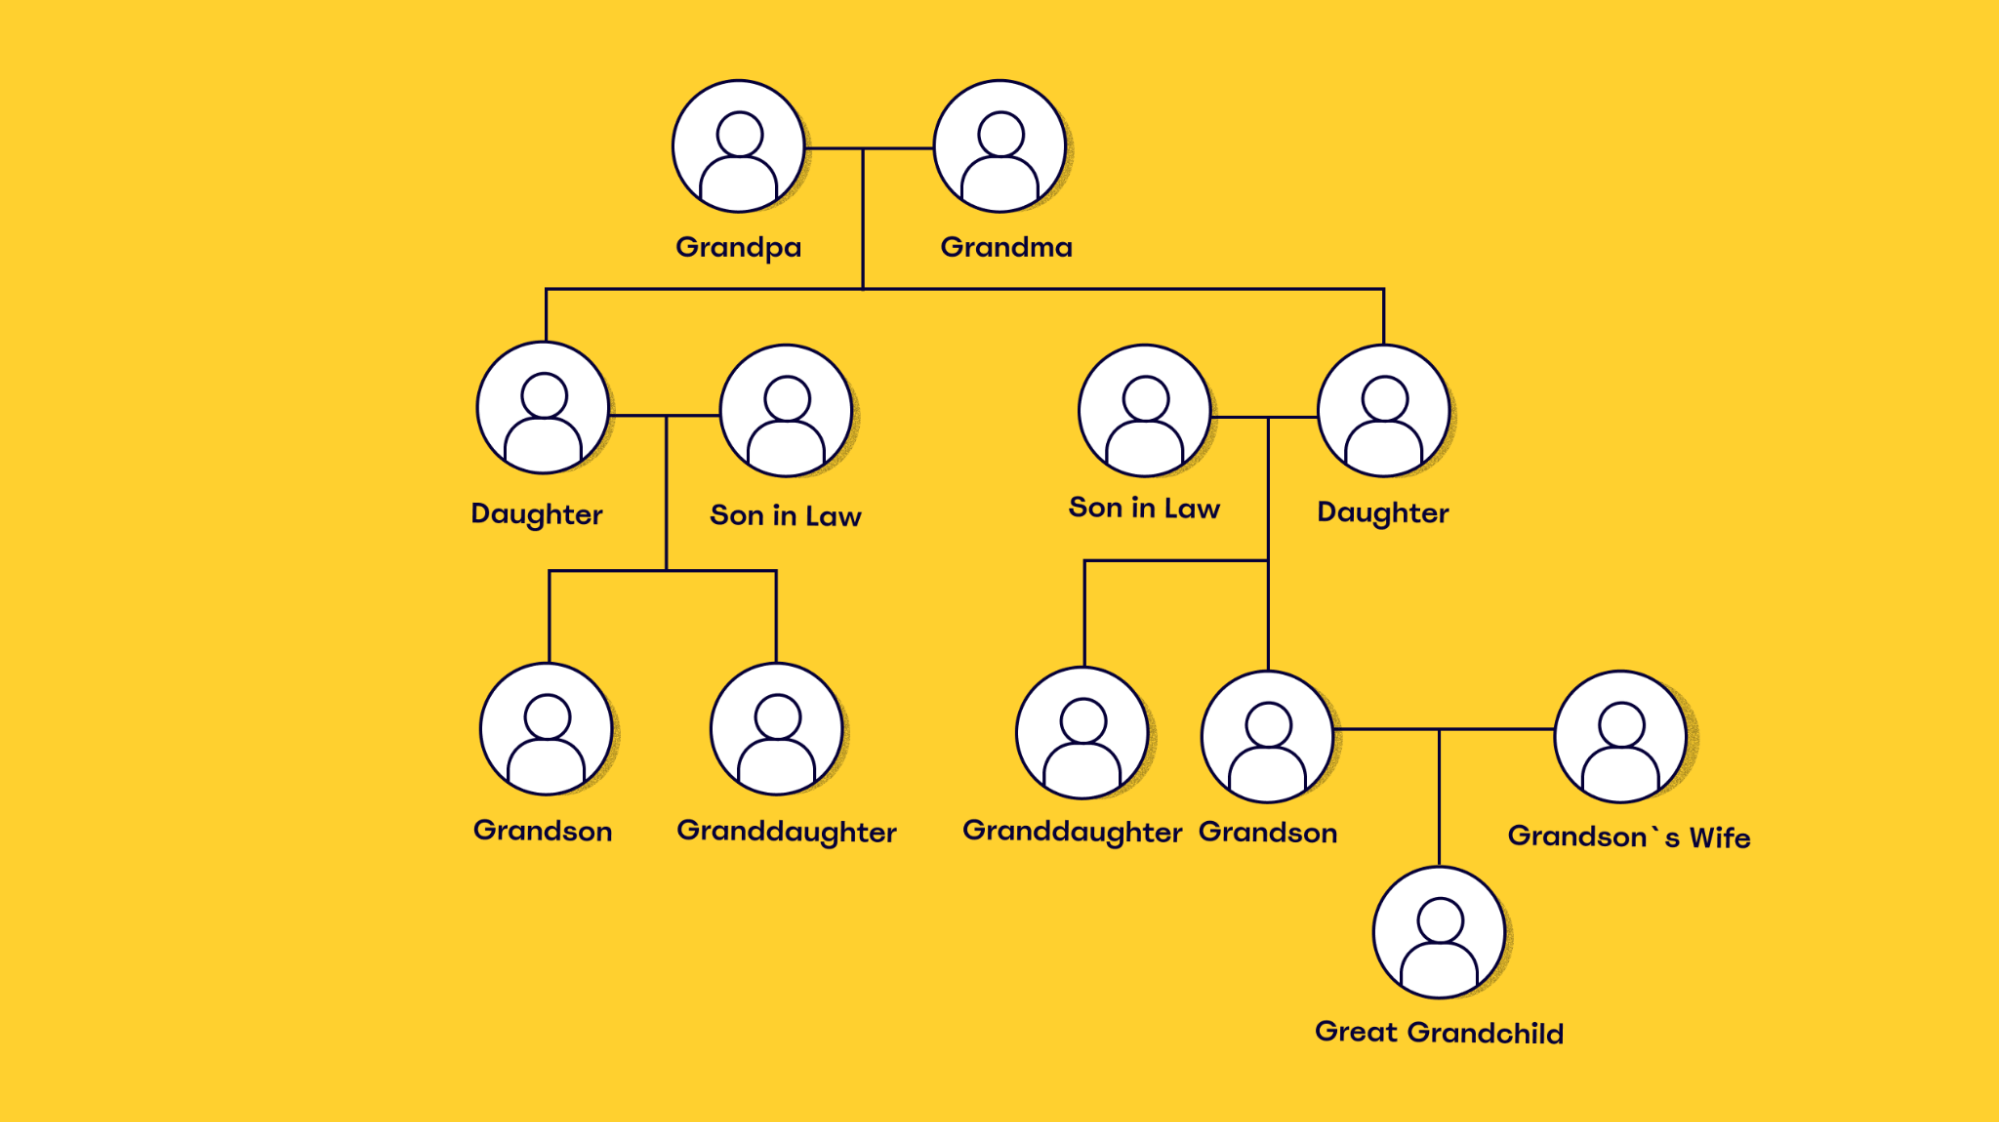
The most basic version uses boxes to represent each family member and lines to depict their relationships. A bracket is used to depict marriage, and the lower boxes from that bracket represent the children.
You can add as many details as you’d like to each box, including important dates and places. Remember, your family tree can be as creative as you desire. This is just a starting point.
How to create a family tree diagram
Creating a family tree online is easy and fast — especially with a family tree template.
Here are the steps you need to follow:
Step 1: Decide how far back you want to trace your ancestry. Do you want to go as far back as your parents, grandparents, or great-grandparents? After you’ve decided, you can represent them by using boxes at the top of the diagram. You can always add more boxes to your online family tree to go back farther.
Step 2: Add their names, birthdates, and date of death within the boxes. You could also add other details like the date of a wedding or their birthplaces. Use brackets to depict marriages.
Step 3: In each bracket or marriage, create branches and boxes to represent each child. Add details to these boxes.
Step 4: Repeat the above two steps for every generation until the tree reaches you and any siblings.
Step 5: Your family tree can continue into a sandglass diagram and include your children and any grandchildren.
Best practices for creating a good family tree diagram
There are no concrete rules to follow when creating a family chart. However, it’s best to keep the following tips in mind:
1. Plan the size and shape of your family tree
The size of your family tree largely depends on its purpose. If you want to print it out and showcase it, your tree needs to be fairly compact. Larger charts are more suited for online sharing.
Your chart can be in multiple shapes, as explained above. Linear flow charts are best for printing, while a Waterfall chart or a Sandglass diagram is easier to create and share online.
2. Limit complexity through your design
Your design dictates the complexity of your family tree. For example, a straightforward ancestral chart usually only requires names, date of birth, and death. But, if you decide to create a more detailed chart, you’ll need to do more research and maybe even change your design.
If you’re just creating a family tree diagram for fun, a top-bottom ancestral or descendants chart is the way to go.
3. Do your research to get your family tree right
Research is key to a good family tree diagram. Contact individuals within your family to make sure all the details are correct and collect any unknown information.
A poorly-made family tree defeats the purpose. You want a chart that can help you or your children understand their roots. For this, you need to do your research.
4. Plan out who will view the family tree, and create the tree accordingly
Decide which relationships to depict and how by thinking of the viewers. If you’re going to share your family tree with many relatives, you want to be cautious enough not to release any secrets or cause tensions unintentionally.
Can you use a family tree diagram in your organization?
Yes. While most people think of family tree diagrams as personal charts, you can use a similar structure to create an organizational chart. Here’s what it looks like:
Rather than identifying your relatives, an organizational chart is used to visualize the hierarchy and structure of a company.
So, a small company’s org chart will have the CEO at the top, followed by the managers of different teams, and then the team members.
An organizational chart, despite its name, does not have to be an overview of the entire business. It can be used on a departmental or project level as well.
For a team-level org chart, each box will contain details like name, job title, and role within the team. You could even add the date of joining to show how experienced each individual is.
Why is an organizational chart important?
Org charts provide the following benefits:
- Depicts a clear structure that shows each person’s role in the company. This helps identify their contribution to achieving business goals.
- Helps avoid conflict by clearly representing each employee, team, or department’s roles and functions. This also boosts efficiency and prevents multiple teams from working on the same task.
- Shows each manager’s area of supervision. This will help businesses identify if all the managers are carrying their weight or if leadership changes are needed.
- Shows which employees can view/edit sensitive data. Role-based access controls are essential for every workspace, as they dictate who gets to see what information.
- Helps with designing work teams, as well as analyzing budgets and allocating resources accordingly.
- Highlights any issues with your company’s structure and helps identify any talent gaps within departments or teams.
Examples of a family tree-like diagram in the workplace
Many charts or diagrams within an organization use the same format as a family tree diagram but represent different values. Here are six common examples:
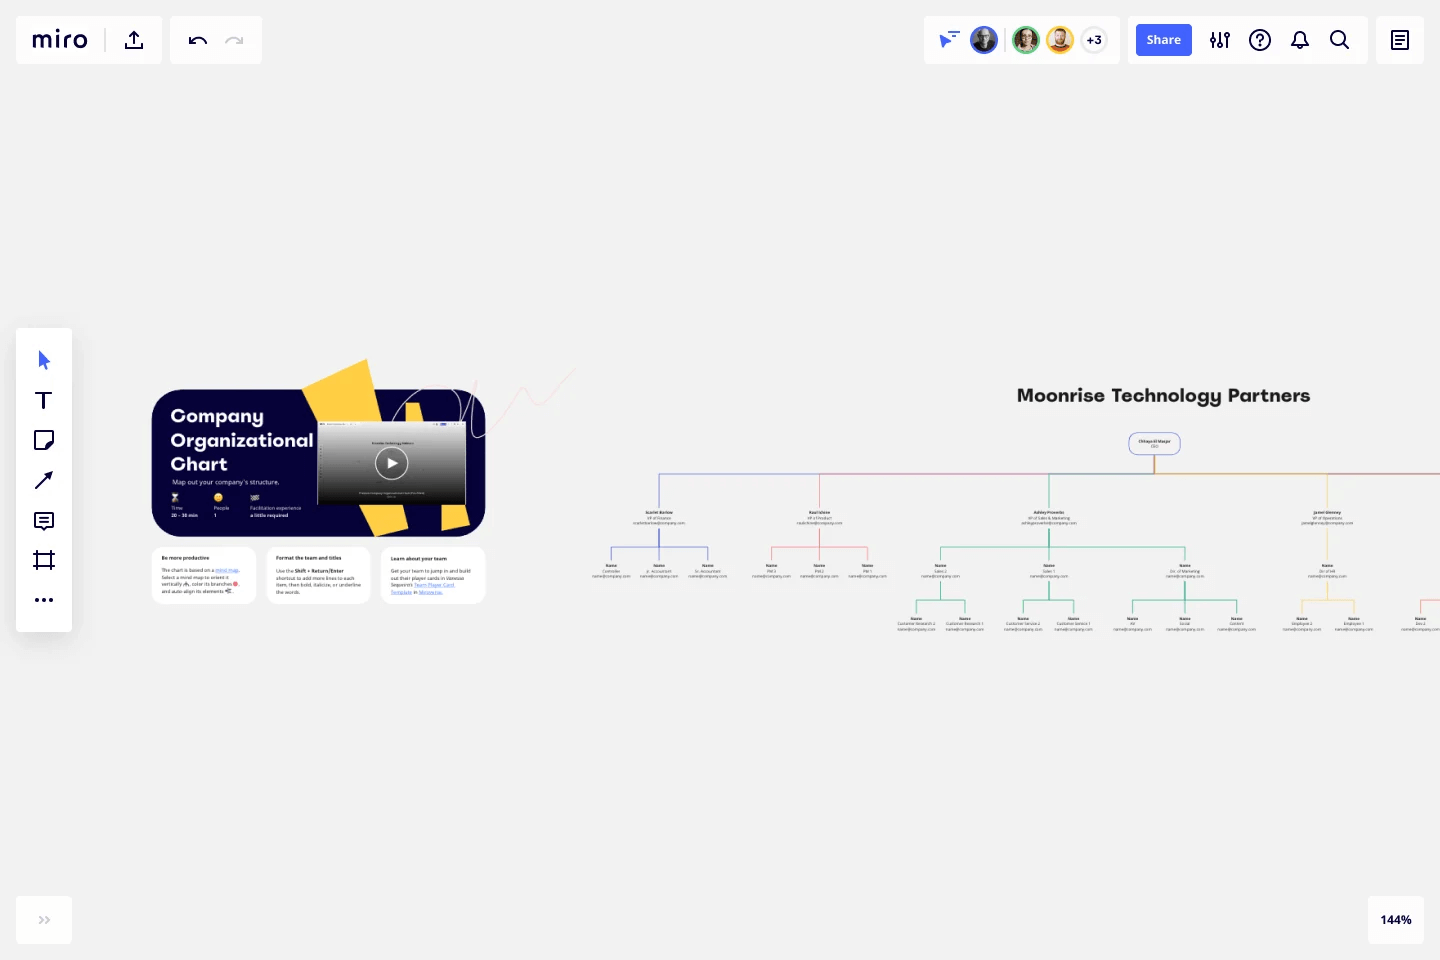
Project organizational chart
A project organizational chart breaks down every employee relevant to a project and their role within it. It also visualizes the hierarchy of the project team, starting with the stakeholders, project managers, team leads, and employees.
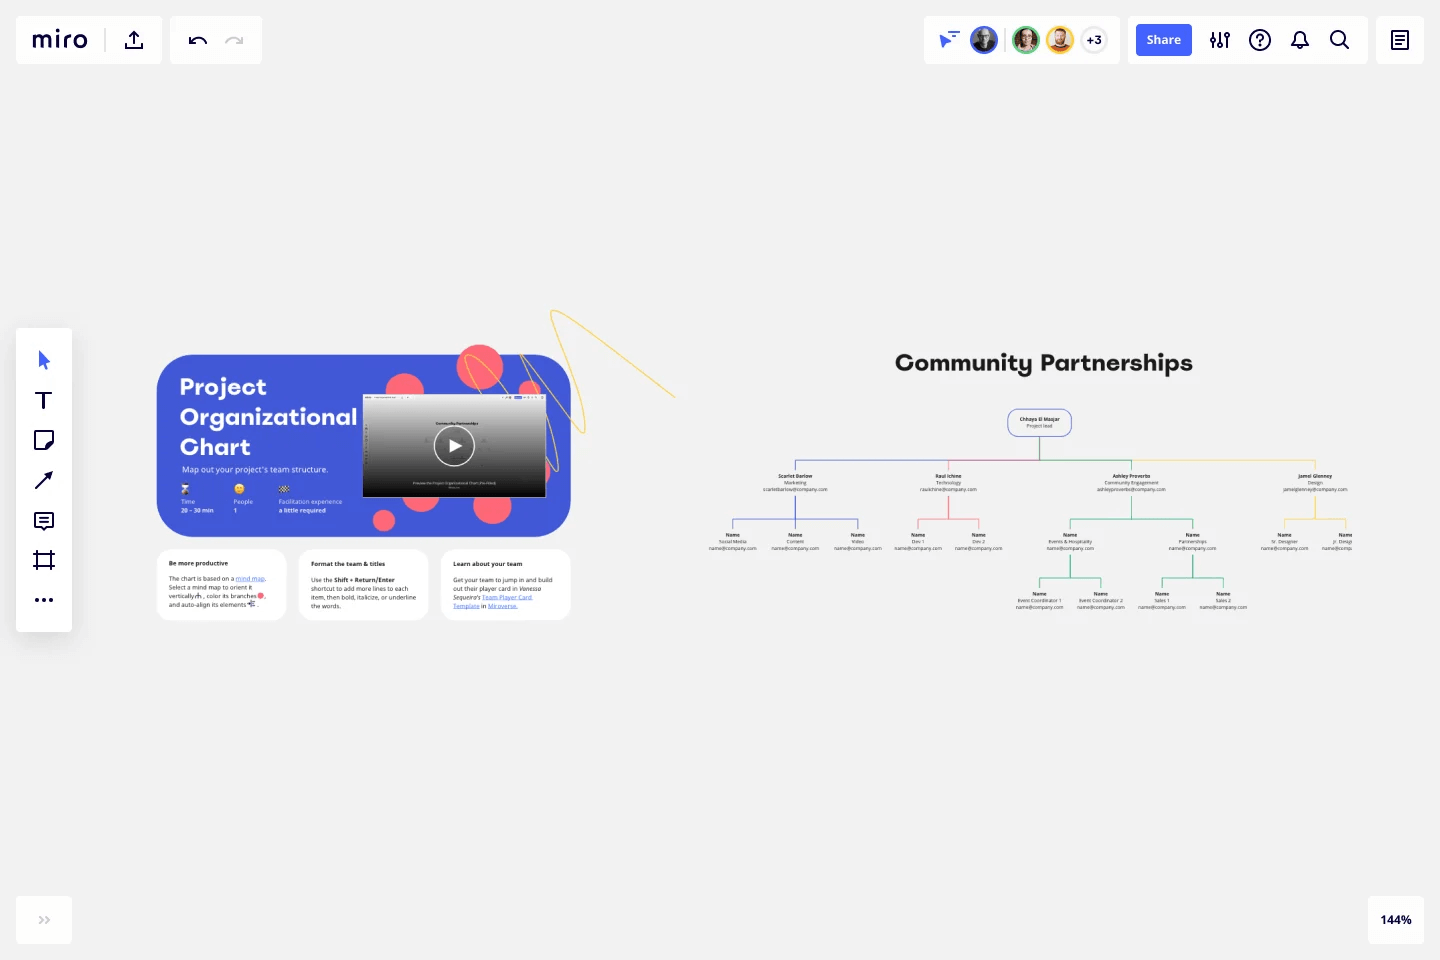
The template helps everyone understand what is expected of them in the context of the project.
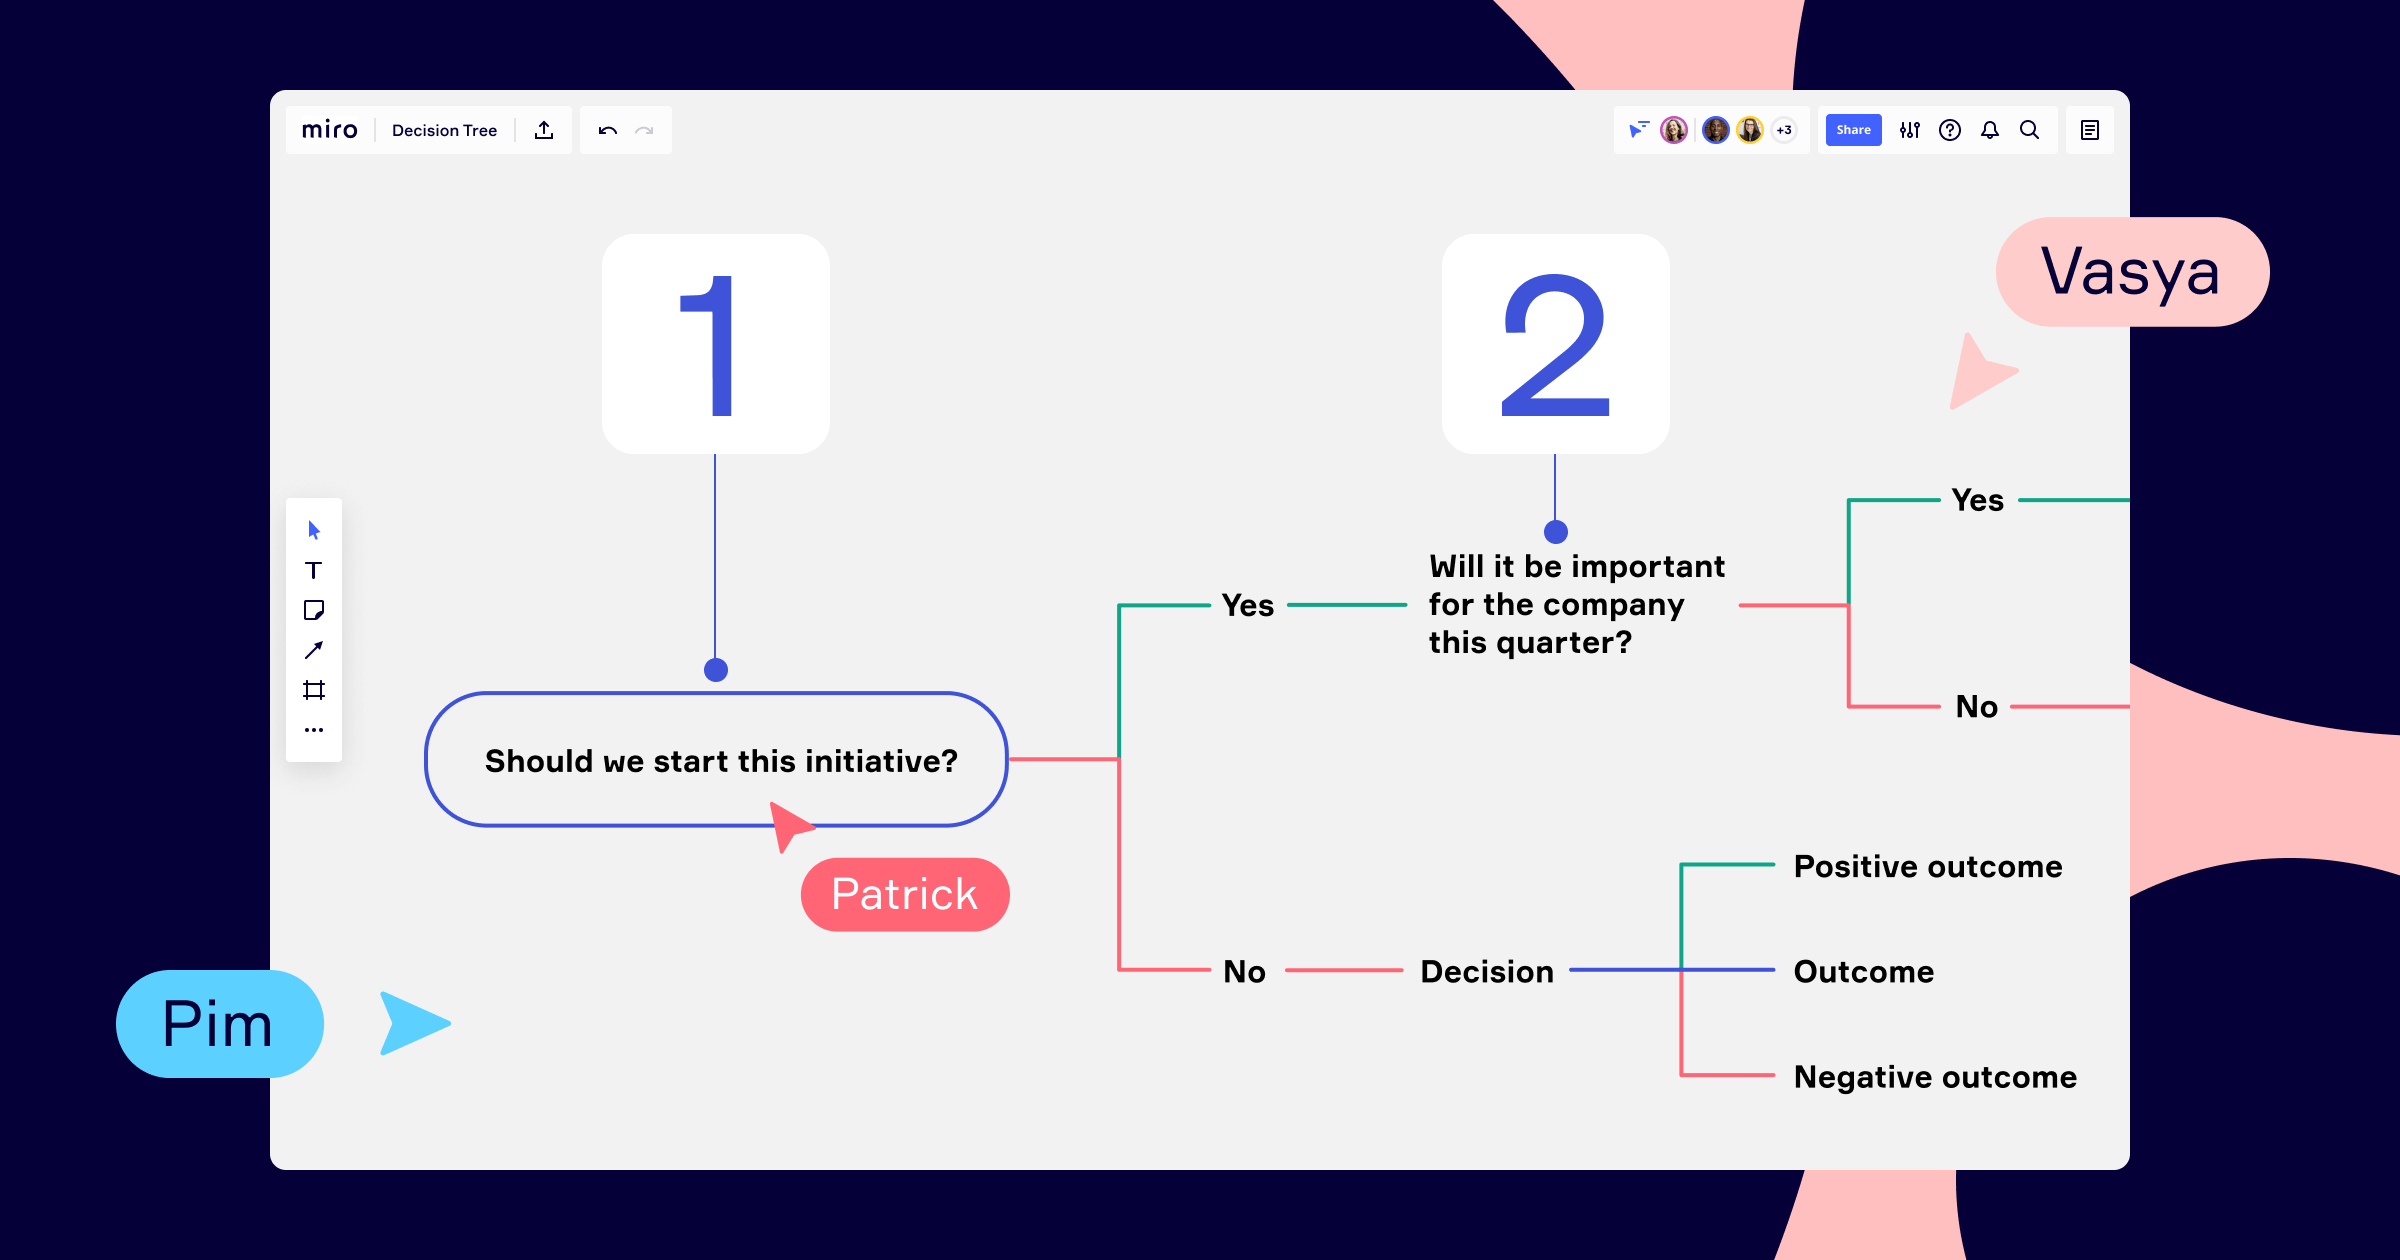
Decision tree
When an organization or a department is faced with a complex decision, a decision tree helps simplify and visualize the consequences of each choice.
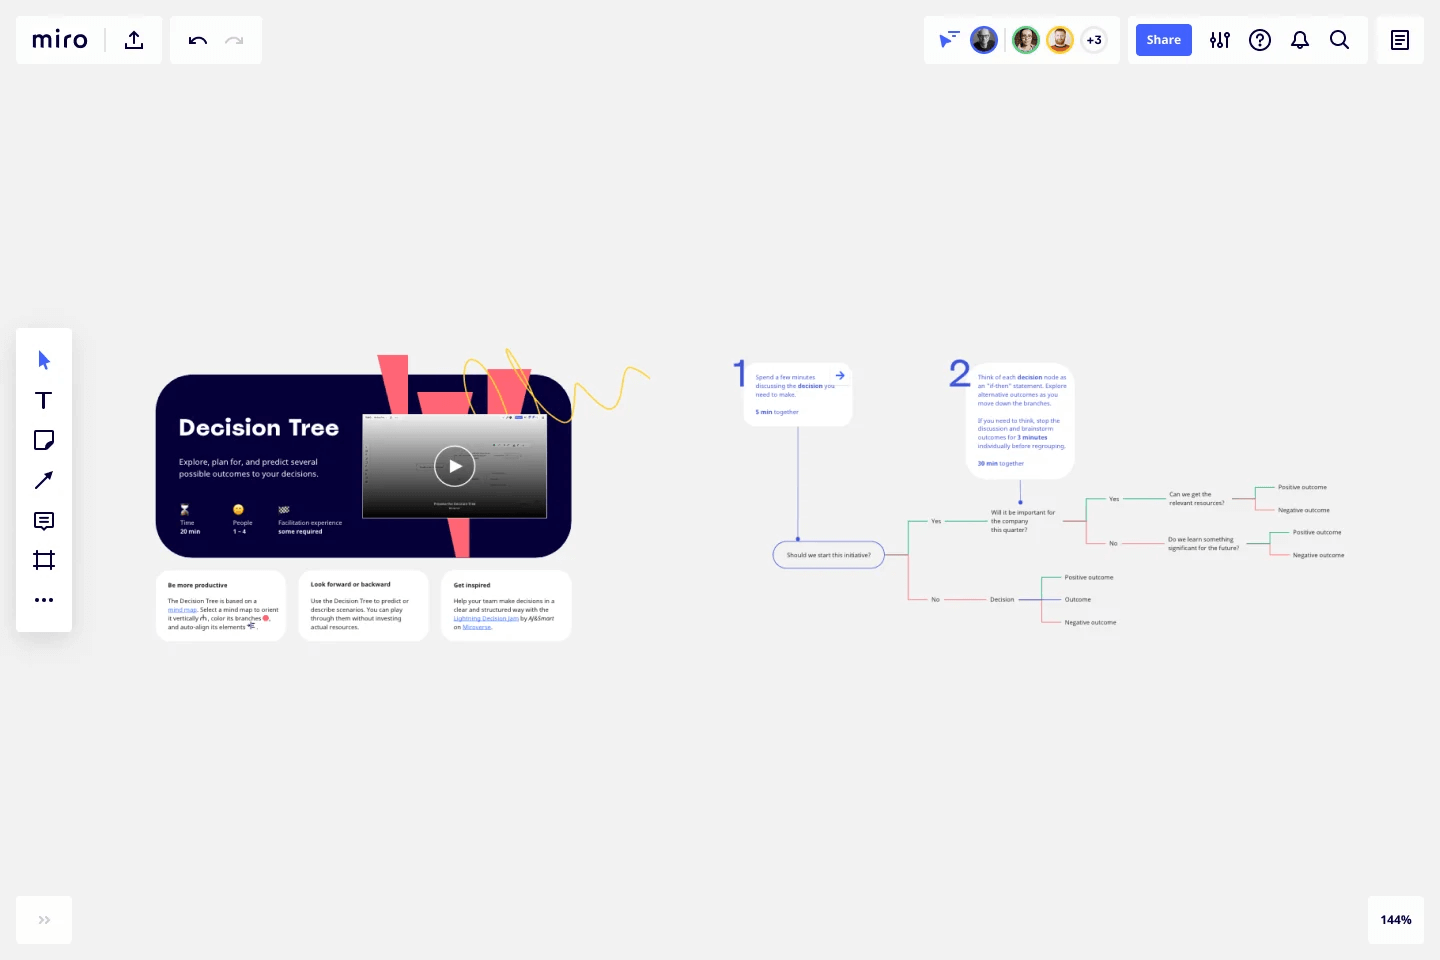
This diagram starts with each decision at the top of the chart and then branches off into the potential outcomes of these decisions.
Objectives and key results (OKRs)
Every organization has a set of goals they want to achieve, and an OKR (objectives and key results) chart helps them decide if their goals are realistic and how they will be achieved.
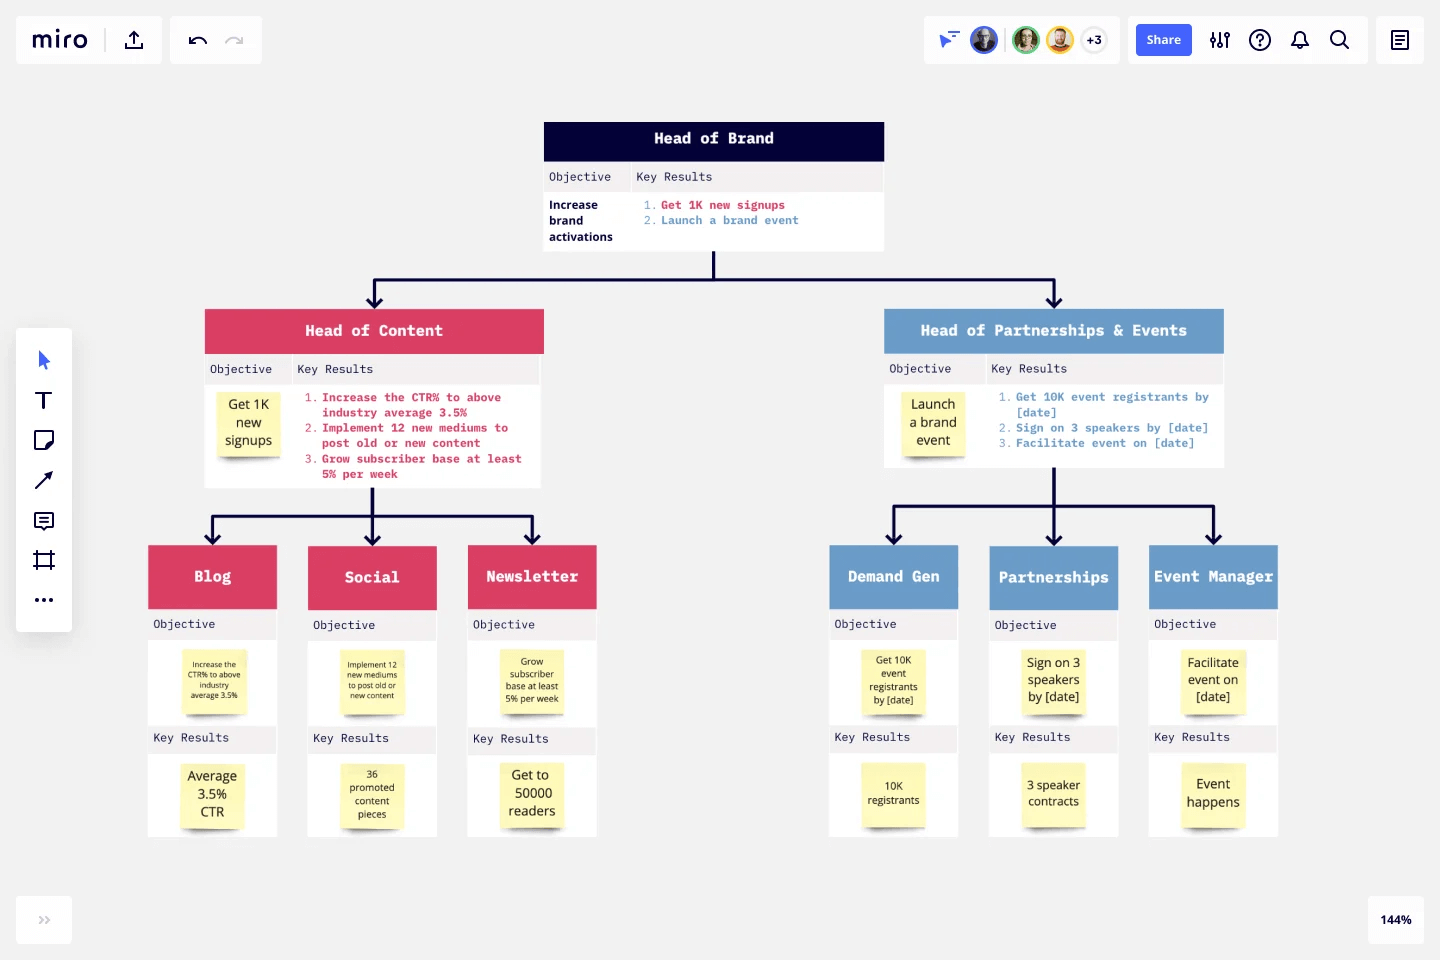
In a family tree-like diagram, department heads can track strategic objectives and key results that help the team progress toward these objectives. They also list the initiatives used to achieve the key results.
Strategic planning
Every business has strategies in place to fulfill its objectives, and a strategic planning diagram visualizes them.
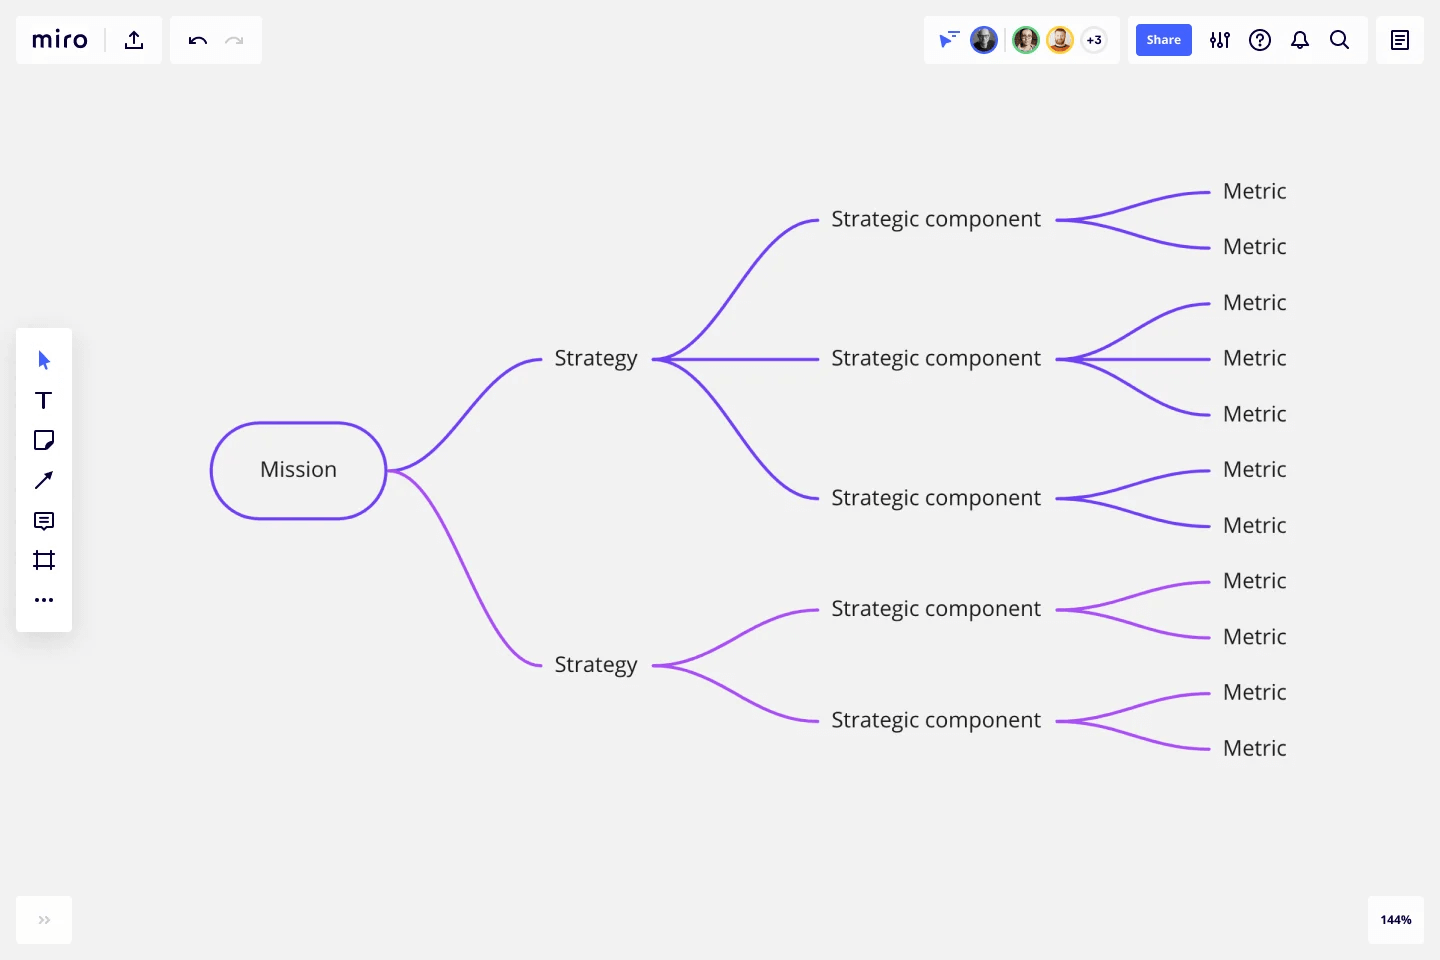
You can use strategic planning on an individual, team, or organizational level to track goals and the steps to achieve them.
Impact mapping
Impact mapping is a technique used in strategic planning that illustrates the steps needed to fulfill company goals.
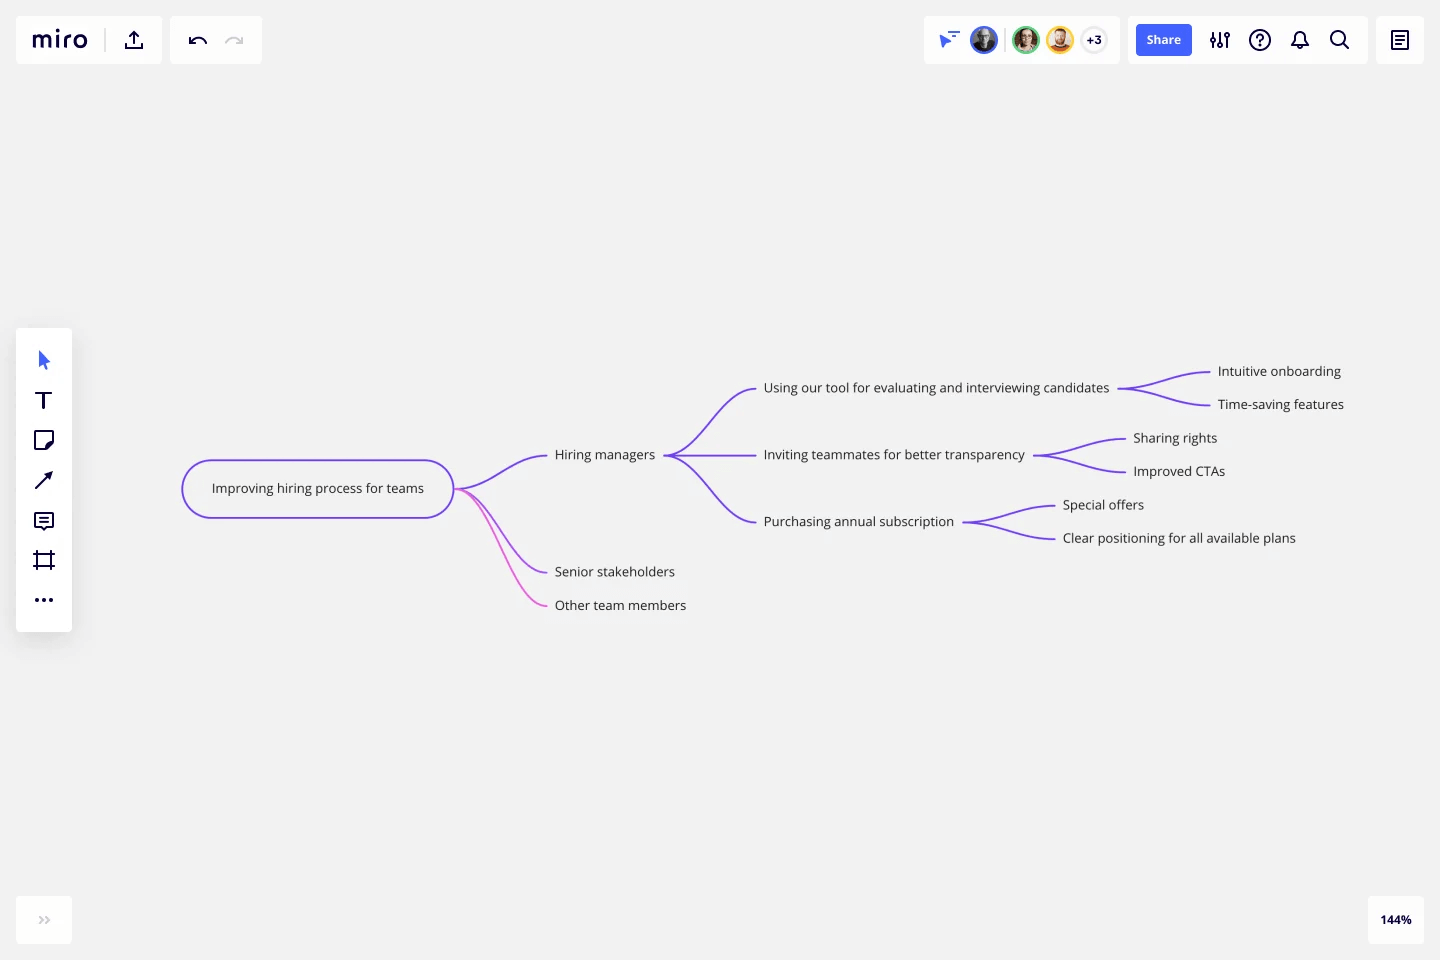
It has the same structure as a left-to-right family tree, except in this case, it starts with the primary objective and then branches off into different strategies to achieve it.
Stakeholder map
You can better understand every person’s influence over a project with a stakeholder map. Here, the project or product is at the center, similar to a sandglass diagram, and every element that affects it is listed on either side.
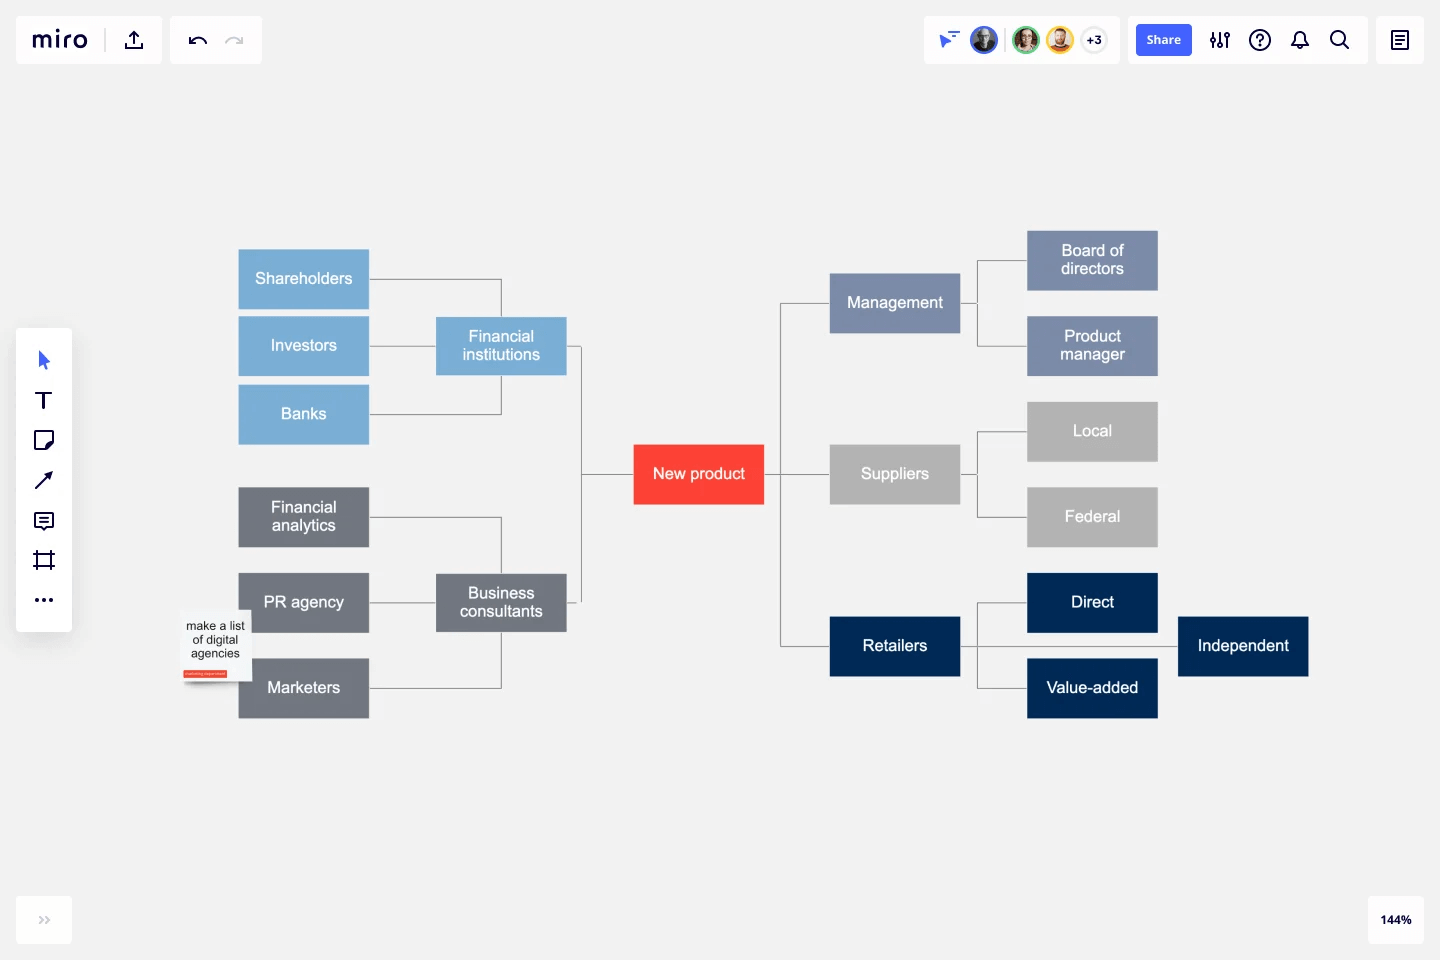
Rather than list marriages and children, this chart shows different stakeholders and uses brackets to depict dependent factors.
Apart from the templates we’ve listed here, you can find templates to create any chart you need in the Miroverse.
Create your own family tree with Miro
We’ve taken a comprehensive look at family trees and how great they are for personal and professional use.
A personal family tree can highlight all the important people in your life and help you record your history for future generations to see.
A professional family tree, on the other hand, has multiple use cases depending on the situation. Try now Miro’s family tree maker and start diagramming your own family tree.