50 Tree diagrams and independent events
 Tree diagrams come in handy when we’ve got more than a couple of events.
For describing sample spaces of 2 sequential events (like rolling 2 dice), we found a table useful, however once we are describing three or more sequential events, we might prefer to use tree diagrams.
The multiplication rule applies whenever we have sequential outcomes that are ‘independent’ of one another. Independence means that what happened previously has no impact on the probability, i.e. there is a 1/6 probability of rolling a 6 on the second die we roll, no matter what the roll was on the previous one. Similarly, when you flip a coin, it doesn’t matter what happened previously (even if you have flipped 10 heads in a row), the probability of flipping a head on the next flip is still ½.
Multiplication rule for probabilities: [latex]Pr(A) \times Pr(B)[/latex]
If we denote the probability of an event A occurring by Pr(A) and the probability of an event B occurring by Pr(B) then the probability of A and B occurring is [latex]Pr(A) \times Pr(B)[/latex]
Let’s have another look at the tree diagram for rolling a die 3 times.
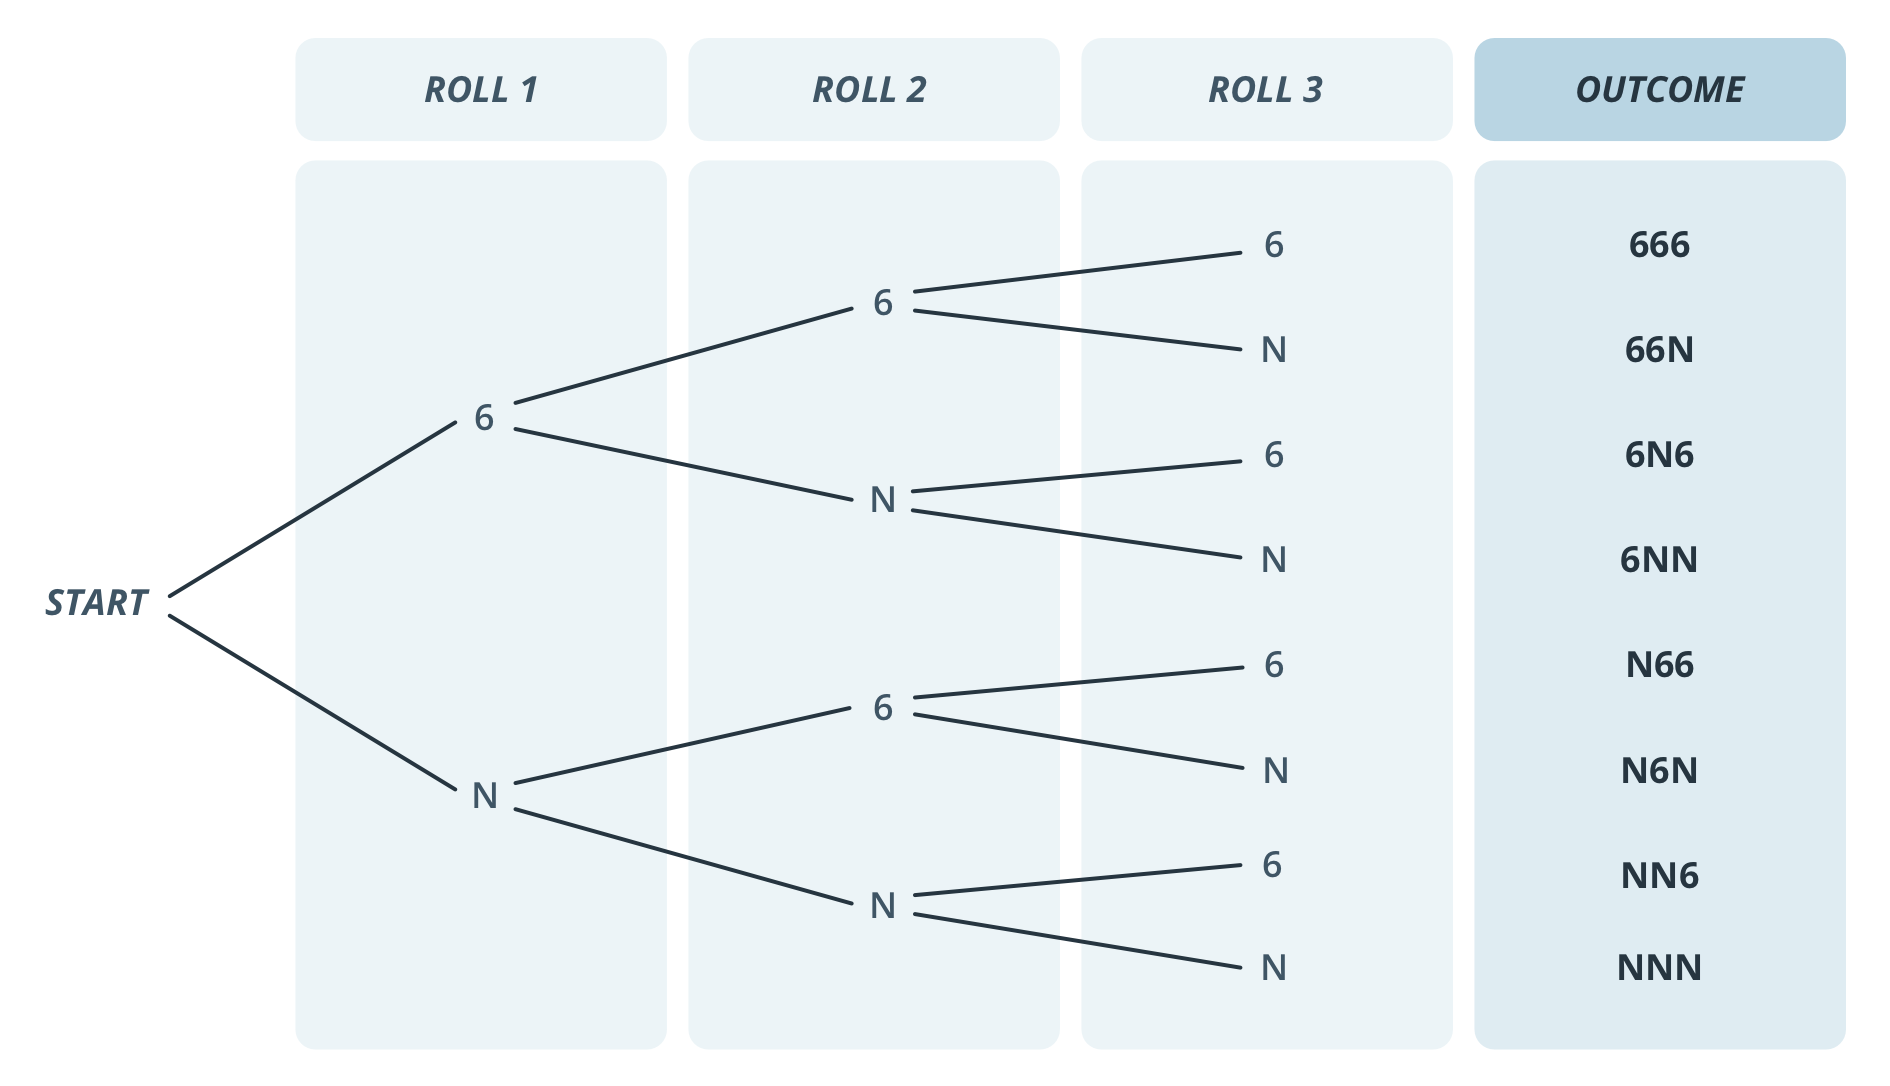
In the video, we just worked out the probability of rolling NNN and subtracted this from 1 to work out the probability of at least one 6. However if we wanted to work out the probability of exactly one 6, then we’d need to consider the different paths that lead to this. We have 6NN, N6N or NN6.
For rolling 6NN we have the calculation:
[latex]\frac{1}{6}\times\frac{5}{6}\times \frac{5}{6}=\frac{25}{216}[/latex]
which will be the same as rolling a N6N or NN6 (since the order of multiplication doesn’t change the result – but that means if we want to know the probability of rolling a single 6, we have to add these three probabilities together to get 75/216).
Free throws
 |
Suppose a basketball player has a 5/6 chance of making each free throw. If each free throw is treated as an independent event (i.e., missing the first doesn’t discourage her and make her more likely to miss her second), what would be the chance of her hitting 2 out of 3 free throws? Draw a tree diagram and calculate the total probability. |
