Measuring and Mapping Food Security Status of Rajasthan, India: A District-Level Analysis
 Surendra Singh Jatav
 Sanatan Nayak1
 - 1Department of Economics, Babasaheb Bhimrao Ambedkar University, Lucknow, India
- 2Indian Council of Agricultural Research (ICAR), National Institute of Agricultural Economics and Policy Research (NIAP), New Delhi, India
The present study tries to analyse the status of food security, along with its various components, such as food availability, accessibility, and stability with the help of a multidimensional index across districts of Rajasthan, India based on an indicator approach. The QGIS mapping computer application and quintile method were used to map districts into low, medium, high, and very high categories. Furthermore, multiple regression analysis was applied to find out the significant determinants of food security and its respective components. The results confirm that there is a wide range of inequalities in terms of food security and its components of availability, accessibility, and stability across districts. It was found that the Ganganagar district (0.407) was rated the most food-secure district due to relatively higher food stability (0.401) in the Rajasthan state. On the contrary, lower food availability (0.084) and accessibility (0.183) contributed to the lowest food security in the Dungarpur district. Moreover, districts associated with dry regions are highly vulnerable and relatively less food secure compared to districts having surface irrigation facilities. Hence, the study recommends; diversification from farm to non-farm activities; sufficient storage capacity to control price fluctuations throughout the year, formulation and dissemination of climate-resilient technologies; investment in infrastructure, promotion of water management, conservation technologies, regulation and replenishment of groundwater in rural areas for augmenting cropping intensity; district-specific policies to arrest food insecurity; and strengthening the coverage of rural employment programme, i.e. MGNREGA.
Introduction
India stands first among the rainfed agricultural countries of the world in terms of both extent and value of produce, with 66% of its total area as cropland (Planning Commission, 2012). It is the second-largest producer of rice and wheat, while 50% of India's production is under rainfed conditions (FAO, 2018). In the past century, severe climatic changes have been observed: an increase in surface temperature by about 0.4°C throughout India, and a decline of monsoon rainfalls by 6–8% over northern India (GoI, 2008). The monsoon rainfall variations include delay in onset, long dry spells, and early withdrawal, which strongly affect the productivity of rainfed farming (Venkateswarlu and Singh, 2015). Moreover, it has been projected that unless people adapt their farming behavior, there is a probability of a 10–40% loss in crop production by 2080–2100 due to climate change (Aggarwal and Sivakumar, 2010). Climate change will act as a hunger risk multiplier by negatively affecting food security, food stability, rural income, food prices, and crop yields (Krishnamurthy et al., 2012). Millions of rainfed smallholder farmers will experience immediate hardship and hunger as a consequence of climate change since they will be less able to make adequate decisions about when to sow, what to grow, and how to use inputs in time (National Intelligence Council India, 2009) along with having low adaptive capacity.
Several studies have shown a significant decline in the major crop yields like rice, wheat, and maize under different temperature and rainfall scenarios (Sanghi and Mendelsohn, 2008; Guiteras, 2009; Auffhammer et al., 2012) along with loss of farm revenues. During the period 1950–2000, the per capita arable land declined from 0.48 to 0.15 hectares and is further projected to reduce by 0.08 hectares by 2020, due to rapidly growing urbanization and industrialized activities (Mall et al., 2006). As per NITI Aayog's (2018) estimation, 54% of India's groundwater wells were declining and 21 major cities would be run out of groundwater by 2020 affecting nearly 100 million people. Climatically specific areas such as rainfed regions are at a higher risk of climate variability (IPCC, 2018) due to low and erratic rainfall, recurrent droughts, lower soil fertility (Singh et al., 2014), and other interlocking socio-economic stress factors. These stresses, if not handled appropriately, could engender or “propagate” drastic social and economic impurities associated with food security.
The term “food security” has been used in nearly 200 different ways across the world (Smith et al., 1993), but the most commonly cited definition comes from the first World Food Summit (FAO, 1996) which proposed that food security “exits when all people, at all times, have access to sufficient, safe and nutritious food to meet their dietary needs and food preferences for an active and healthy life.” This definition is translated into the four aspects of food security: food availability, food accessibility, food utilization, and food stability (Gross et al., 2000; FAO, 2006). The first dimension “food availability” refers to the physical quantities of food of an appropriate quality that is supplied and distributed through domestic production or imports (FAO, 2006). The mere presence of an adequate supply does not ensure that a person can obtain and consume food. A person or household also has access to food (FAO, 2008). Hence, “food accessibility” is a measure of the ability to get food, which depends on household and individual purchasing power and food prices (Singh and Alka, 2019; Singh, 2020a), as well as legal entitlements, political willingness, and social structure. Further, “food utilization” is the third dimension and relates to whether or not individuals or households are able to obtain sufficient energy and nutrition from food consumption (FAO, 2018). The last dimension is “food stability” which depicts the situation in which a country, state, district, household, or individual is food secure at all times (Singh and Alka, 2019; Jatav et al., 2021a).
Currently, global food insecurity exists. The number of undernourished people increased by 17 million between 2016 and 2017, causing health, and social issues such as hunger. Further, one in every seventh person is “hungry.” As such, a significant percentage of the world's population is likely to be exposed to food insecurity by 2030 (FAO, 2018). Likewise, Madani et al. (2015) projected that by 2030, the demand for energy, water, and food resources are expected to increase by 25, 40, and 50%, respectively, thus inducing multiple challenges. Therefore, the increasing demand for food necessitates large-scale agricultural intensification to meet the demand for food. The extensive increase in agriculture production will have a positive impact by reducing hunger. For instance, the average available food for consumption per capita will shift from 2,770 to 3,070 kcal/person/day between 2007 and 2050 globally, respectively (Alexandratos and Bruinsma, 2012). Hence, the increase in food production would induce intensive resource utilization to meet the primary raw material requirement in the agriculture sector.
The majority of mainstream literature has followed the FAO (1996) definition of food security at the country and state level, i.e., Mahadevan and Sandy (2013); Payne et al. (2016), Farukh et al. (2020), Swati and Arora (2021) in India; Tadesse et al. (2020) in Ethiopia; Namany et al. (2020) in Qatar; Farukh et al. (2020) in Pakistan & Bangladesh; Poudel and Munisamy (2021) in Bolivia, to protect the food security status. For instance, Mahadevan and Sandy (2013), in India, have examined the influence of social factors such as caste and religion at regional level. Study evidenced that food security was being adversely affected in households particularly from the low caste groups or belonging to a religious minority. Their findings show that due to the complex social system in India development programmes, such as the Food for Work and the Public Distribution System, have limited success in addressing food security. This warrants a major rethink of the strategies in place for effective targeting of the food insecurity as opposed to addressing the plight of the hungry by way of poverty alleviation. Likewise, Tadesse et al. (2020), in Ethiopia, captured differential outcomes from individuals' perceptions and experimental indicators on food insecurity. The results showed a significant difference in food insecurity levels between the direct self-reported measures and the measure based on the list experiment method. The bias varies by the type of food insecurity measures, i.e., while respondents tend to overstate the level of food insecurity when asked about food availability questions, they tend to understate when asked about food access questions. Non-linearity is explained by the relative importance of economic and social desirability effect in food availability and food access questions. Moreover, Sen (1981) highlighted that food-related problems are influenced not only by food production and agricultural activities but also by the structure and processes governing entire economies and societies. Following his view, food insecurity has been caused not only by scarcity, but also by institutional failures that lead to suboptimal food distribution.
Despite recent numerous measures on improving the status of food security, measurement of incidence and intensity of food security remains a challenge. This is mainly because food security is an elusive and complex concept that encompasses availability, access, and utilization of adequate and appropriate (i.e., safe and nutritious) food in an undisrupted manner (Barrett, 2010). Implicitly, the concept extends to the social and economic aspects of food (people's dietary needs and preferences given their income, prices, and safety net arrangements) beyond physical access, which further complicates its measurement (FAO, 1996). For this reason, researchers use a diverse set of proxy indicators or dimensions that captures and neglects different aspects of food security. The objective of the measurement of a given food security indicator and approach is based on the availability of resources (Barrett, 2010). The literature on food security measures, so far, was mainly focused on the extent to which the different indicators capture the multi-dimensionality of food security in different contexts (Clay, 2002; Maxwell et al., 2014; Vaitla et al., 2017; Haysom and Tawodzera, 2018; Food and Nutrition Security, Analysis, 2019; Ibok et al., 2019; Farrukh et al., 2020a,b).
As far as the food security issue in Rajasthan, India is concerned, it is a pressing concern and challenge which requires an intelligent decision-making approach to manage resources. This is because the food sector is exposed to the harsh climatic conditions of water scarcity. In fact, water consumption in agricultural processes amounts to ~40% of the total available quantity, of which, more than 70% is sourced from fresh aquifers (GoI, 2019). Further, the food sector in Rajasthan historically has suffered from various obstacles in local food production, in terms of (i) lack of availability of arable land and suitable soil conditions, (ii) presence of hyper-arid weather conditions, (iii) scarce water resources, such as freshwater aquifers, with their extraction rates currently at unsustainable levels surpassing renewal rates, and, (iv) lack of diversity in the local food production portfolio. Consequently, this resulted in a major reliance on food imports consisting of more than 80% of the total demand for food (Singh and Alka, 2019). Hence, the food security assessment in Rajasthan, at a disaggregated level, becomes imperative in order to delineate and prioritize food-insecure regions which require immediate attention for future sustainability.
After a detailed review of literature on Rajasthan's food security, it is observed that previous studies have used the panel model (Sinha and Kulshrestha, 2012), indicator approach (World Food Programme, 2001, 2009; Raghuvanshi and Smita, 2015; Payne et al., 2016; Saxena et al., 2020), and dietary approach (Jha et al., 2013) to access food security. Aforesaid studies have used either large-scale secondary data to access security at state-level or household/individual field survey data. None of the studies have used district-level data and indicator approaches to evaluate the food security status of districts associated with the Rajasthan state. The present study bridges this research gap. Further, quantification of indicators at the disaggregated level is also the prerequisite to understanding the regional dimensions of food security. Hence, rational indicators are first grouped into three areas (i.e., food availability, food accessibility, and food stability excluding food utilization aspect) and then districts are categorized into low, medium, high, and very high based on the food security status using the quintile estimation technique. Lastly, validation of indices is also imperative; hence, sub-components of the food security index are validated using Spearman's rank correlation. Moreover, socioeconomic, agricultural, and extension services data were used to examine the determinants of food security in the Rajasthan state.
The paper is organized into four sections. Section 1 briefly discussed the food security and contribution of the present study in the existing literature, section methods and materials provides method and materials encompassing data and analytical tools used, section results and discussion presents results of the study, while section conclusion and policy implication presents the conclusion and policy implications.
Methods and Materials
Study Area
Rajasthan is situated in the north-western region of the Indian sub-continent and possesses huge tracts of a desiccated area with more than 70% of the region covered by the Thar desert (Figure 1). With a total area of 342,239 square kilometers, the state consists of three agro-climatic zones: Trans-Gangetic Plains, Central Plateau & Hills, and Western Dry Region, along with 33 districts, 268 tehsils, 295 development blocks, and 44,672 revenue villages. The state has semi-arid to arid climatic conditions with the mean temperature varying between 0 and 50°C and a normal annual rainfall of 463.80 millimeters. The majority of Rajasthan's population resides in rural areas and is primarily dependent on agriculture and allied activities for livelihoods. Compared to the national average of 2,153 kg/ha, the state has a lower food grain yield of 1,367 kg/ ha (GoI, 2017). Low and erratic precipitation patterns in Rajasthan coupled with the arid environmental conditions further result in a lower groundwater recharge rate (Central Ground Water Board, 2017). Besides the deteriorating quality of land owing, climate increased magnitude of desertification pose a serious challenge to food security in the state. The future climate projections indicate that accelerated warming with annual mean temperature is likely to increase by 2.0–2.5°C by 2021–2050 (Gopalakrishnan et al., 2011), whereas a decline is projected for rainfall (Kumar et al., 2016). Further, 11 out of 33 districts were found to be highly vulnerable to the changing climatic conditions with Hanumangarh, Jaisalmer, and Ganganagar being the most vulnerable districts (Singh et al., 2019). Furthermore, 3% of children under the age of five are stunted (IIPS and ICF, 2017) which indicates the severity of malnutrition in Rajasthan.
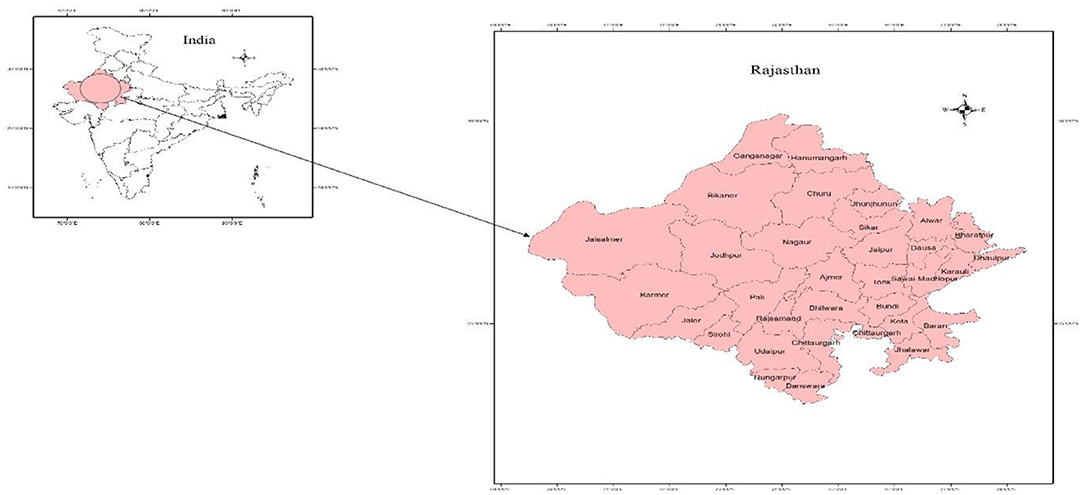
Figure 1. Map of the study area. Source: Authors Map, 2019.
Data and Descriptive
The study uses district-level data to evaluate the food security of districts in Rajasthan. After a detailed review of Shakeel and Zaidy (2012); Kumar et al. (2015); Menezes (2015); Mondal et al. (2015), and Singh and Alka (2019), a total of 20 indicators are used to capture three major dimensions of food security i.e., food availability, food accessibility, and food stability (food utilization is excluded due to data constraint) to compute district-level food security indices. Secondary data on identified indicators are compiled from multiple sources (Table 1). The present study introduces two new indicators namely variability in rainfall and variability in temperatures for the food stability index. This is because variability in climatic parameters widely affect the highly vulnerable agriculture system as it is in Rajasthan. Sudden changes in rainfall and temperatures patterns pose multiple challenges for farmers. For example, unprecedented rainfall in the harvesting season is responsible for crop production loss, while attracting pests which add an additional layer of vulnerability in the highly susceptible system.
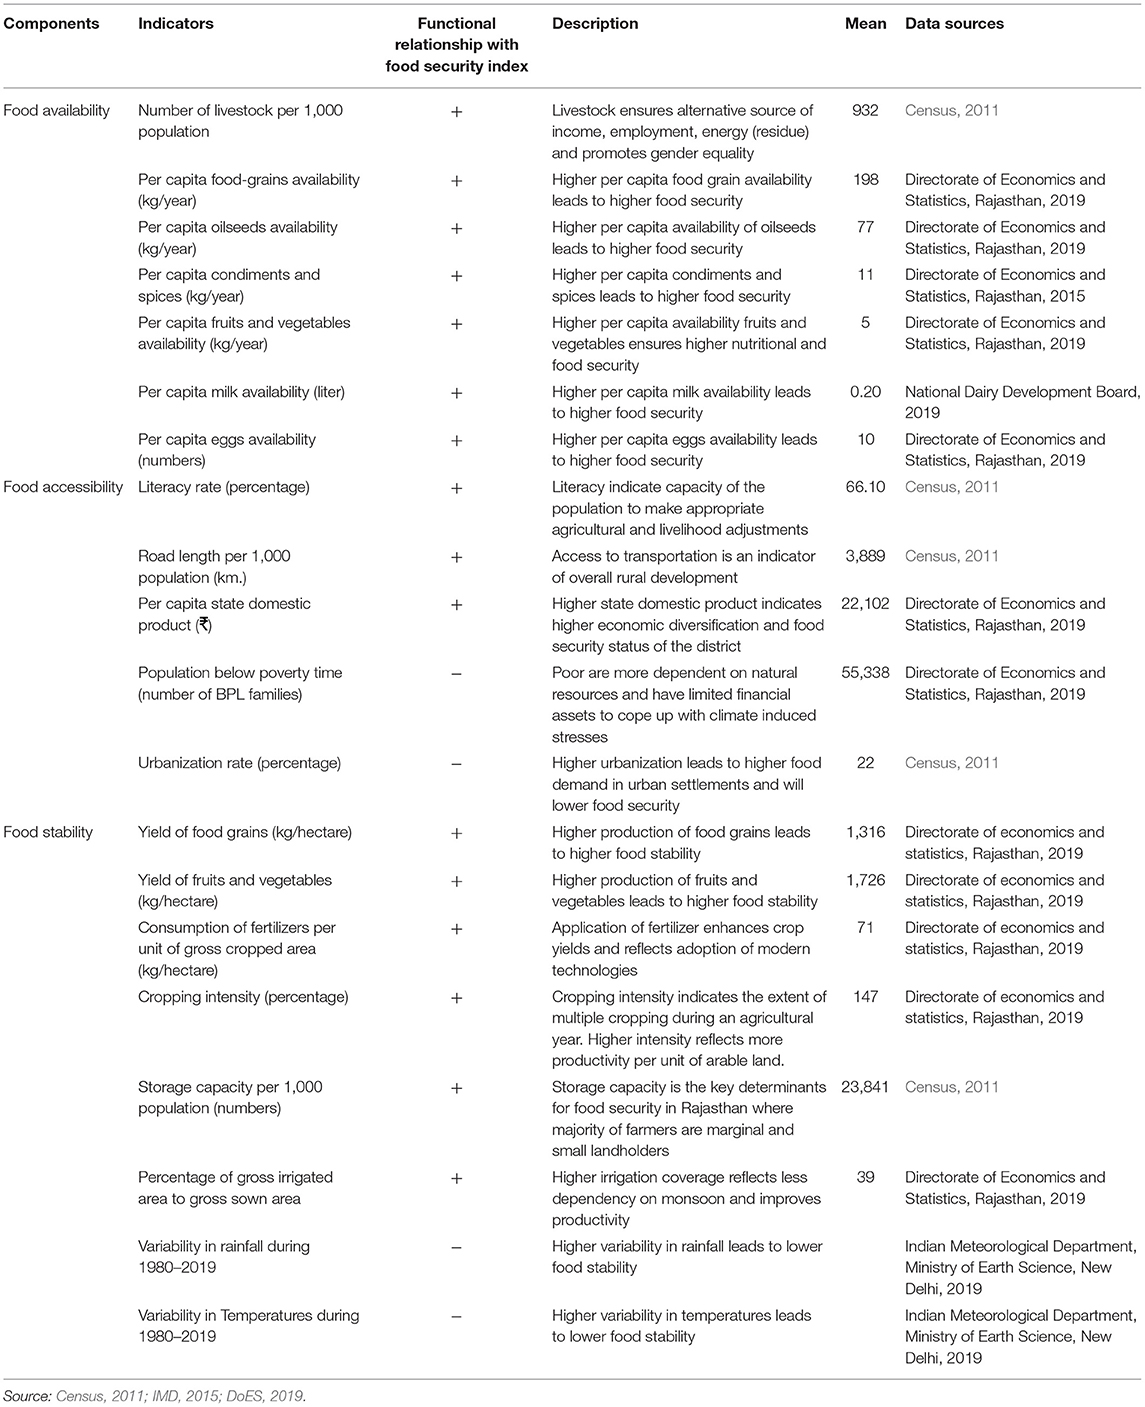
Table 1. Summary of selected indicators.
It presents descriptive statistics which provide insightful information on associate indicators of food security. The per capita availability of food and oilseed is 198 and 77 kg per year, respectively, in the state. Access to food is largely influenced by indicators that reflect the household's resource endowment and knowledge, such as literacy, poverty ratios, level of urbanization, etc. Nearly, 66% of Rajasthan's population is literate and 22% reside in urban areas. Moreover, the stability of the food system in Rajasthan is reflected through storage capacity that amounts to 23,841 tons per thousand population, while cropping and irrigation intensities were reported by 147 and 39%.
Analytical Method
Broadly, there are three methods to assess food security. Namely the simulation data method (Fischer et al., 2009; Dorin and Le Cotty, 2014; Bizimana et al., 2020; Shoaib et al., 2021), dietary intake method (Jensen and Nolan, 2010; Jones et al., 2013; Broussard and Sharad, 2016; Gupta and Mishra, 2020) and indicator approach (Krishnamurthy et al., 2014; Singh and Nayak, 2018b; Chen et al., 2019; Sam et al., 2021). The simulation/panel data method is widely used for the projection of global food security. Scholars have used large-scale data, mostly at the country level, to evaluate and predict food security. The major advantage of this method is its future prediction capability. Predictions can be modified by adjusting future scenarios such as population growth, availability of arable fertile land, availability of water resources, and technological scale. Results from this method could be useful for global food policy planning. Secondly, the dietary intake method is widely used for the assessment of food insecurity at the individual and household levels. It largely focuses on nutritional security and excludes the food stability aspect from the estimation. Further, the dietary method does not have the capability to assess food security at the district or state level. Thirdly, the indicator approach has several advantages which have facilitated widespread utilization in the planning process and policy communication over the years, such as the ability to consolidate a large volume of complex information into a manageable format (Adger, 2000); to use any data at any scale, i.e., individual, household, village, district, state and country for the development of food security index; to use proxy data in the case of non-availability of original data; to identify, prioritize, and rank the food insecure regions to delineate the plausible barriers in the developmental process of a region; and to monitor and evaluate the progress of an intervention.
Normalization
Rescaling of original indicators having different units into homogenous units is a necessary step before aggregation. The process of normalization is undertaken to enhance comparability among the variables which are expressed in different units and ranges, and also to lessen the variability that could arise due to the presence of extreme values. The Organization for Economic Co-operation and Development (OECD, 2008) has prescribed nine normalization methods: (i) ranking, (ii) Z-scores, (iii) min-max, (iv) distance to reference, (v) categorical scale assigns, (vi) indicator below and above, (vii) cyclic indicators method, (viii) balance of opinion, and (ix) percentage method.
The advantage of the ranking method is that it is not affected by outliers and allows the performance of countries to be followed over time in terms of relative positions (rankings). But the major drawback of this method is that a country's performance in absolute terms cannot be portrayed as information. The Z-scores method converts indicators to a common scale with a mean of zero and standard deviation of one. Indicators with extreme values thus have a greater impact on the composite indicator. This might not be desirable if the intention is to reward exceptional behavior i.e., if an extremely good result on a few indicators is thought to be better than a lot of average scores.
Distance to a reference measures the relative position of a given indicator vis-a-vis a reference point. For example, the reference country could be the average country of the group and would be assigned a value of 1, while other countries would receive scores depending on their distance from the average. Hence, standardization indicators that are higher than 1 indicate countries with above-average performance. This method, however, is based on extreme values which could be unreliable outliers Acharya (2006).
The categorical scale assigns a score for each indicator. Categories can be numerical, such as one, two or three stars, or qualitative, such as “fully achieved,” “partly achieved,” or “not achieved.” Often, the scores are based on the percentiles of the distribution of the indicator across countries. Furthermore, the indicator below and above method is transformed such that values around the mean receive 0, whereas those above/below a certain threshold receive 1 and −1, respectively. This normalization method is simple and is not affected by outliers. However, the arbitrariness of the threshold level and the omission of absolute level information are often criticized.
The cyclic indicators method combines indicators into composite indicators to reduce the risk of false signals and to better forecast cycles in economic activities. The drawback of this method is that it implicitly gives less weight to the more irregular series in the cyclical movement of the composite indicator unless some prior ad hoc lessening is performed. Further, the balance of opinion is a special method, in which managers of firms from different sectors and of varying sizes are asked to express their opinion on their firm's performance. Moreover, the percentage method captures annual differences over consecutive years and represents the percentage growth with respect to the previous years instead of the absolute level. The drawback of this method is that transformation can be used only when the indicators are available for a number of years.
Moreover, the normalization process should take into account the data properties, as well as the objectives of the composite indicator. Hence, the present study adopted min-max method (Iyengar and Sudarshan, 1982) to standardize indicators into a common range (0, 1) depending on their functional relationship with the dimension. The min-max method can help in simplifying a complex array of information concerning food availability, food accessibility, and food stability nexus (Singh and Alka, 2019). In this respect, the method is important for informing the public and decision-makers about key food insecurity, livelihood vulnerability problems (Singh, 2020b), and actions required for their management (Nayak and Surendra, 2020; Singh and Nayak, 2020; Jatav, 2021). The major advantage of this method is that it is able to capture food security at any scale i.e., household, village, district, state, and country. Therefore, equations 1 & 2 were adopted for larger-the better-and smaller-the worse-type indicators, respectively.
Where, Zij is the variable index value, Xij is the actual value, Max(Xij) and Min(Xij) is the maximum and minimum value of ithindicator for the jthdistrict.
Assigning Weight
The assignment of appropriate weight for different components is an important issue in the construction of an index. There are three methods widely cited in the literature: equal weight, judgemental weight, and statistical weight (Singh, 2019; Singh and Nayak, 2020; Jatav, 2021; Jatav et al., 2021b). The equal weight method assigns equal weight to all the indicators and components. But it is statistically not appropriate to give equal weight to each indicator because each indicator has differential and relative contribution to the targeted indicators, i.e., food security index (Jatav et al., 2021b). Judgmental weight purely depends on the researcher's understanding and hence, only suitable for field survey data, while statistical weight is appropriate for the secondary data (as the present study used). It assigns weight to each indicator by capturing the relative contribution of the indicator with the targeted index. Hence, the present study used statistical weight method using Equations (3) and (4),
The calculated weights were used to construct component index Pj for jth district using equation (5) where,
Finally, food security index for each district was calculated as an unweighted average of three components. Based on the index scores, districts were ranked in descending order where districts with higher scores indicate greater food security. Further, homogenous districts under each component indices were categorized into four groups; low (0–25th percentile), medium (26–50th), high (51–75th percentile), and very high (76–100th percentile) based on quartile estimation.
Econometric Model for Food Security and Its Components
In order to identify the inter-linkage between the food security index (FSI) with its components, i.e., food availability, food accessibility, and food stability, the Ordinary Least Square (OLS) model was applied. Constructed food security index as a response function was regressed with its components.
Where, FSI is food security index, AVAF, STAF, and ACCF are food availability, food stability and food accessibility; s is the cross sectional districts; θ0 is constant coefficient; and θ1, θ2, and θ3 are the regression coefficient for respective indicators. ∅s is the error term in the model.
Econometric Model for Components of Food Security Index
In order to identify the separate impact of factors on components of food security index, i.e., on food availability, food stability, and food accessibility, the following multiple regression models (Equations 7, 8, & 9) were used as follows:
Where, AVAF is food availability; PCF, PCO, PCFV, PCM & PCE are livestock, per capita food grains, per capita oilseeds, per capita fruit & vegetable, per capita milk, and per capita eggs, respectively. β0 is constant and β1, β2, β3, β4, and β5 are regression coefficients for respective parameters; and us is error term in the model.
Where, STAF is food stability; and LR, RL, PCDDP, BPL and UR are literacy rate, road length, per capita district domestic product, population below poverty line and urbanization rate. γ0 is constant and γ1, γ2, γ3, γ4 and γ5 are regression coefficient for respective parameters; and us is error term in the model.
Where, ACCF is food accessibility; and YFG, YFV, CI, IR, VR and VT are yield of food grains, yield of fruits and vegetable, cropping intensity, and variability in rainfall and temperature. δ0 is constant and δ1, δ2, δ3, δ4, δ5, δ7 and δ7 are regression coefficients for respective parameters; and u_s is error term in the model.
Results and Discussion
Food Availability Index
The estimated value of the food availability index reveals that the Baran district (0.448) had the highest food availability followed by the Ganganagar (0.366) and Jhalawar (0.346) districts. Conversely, the Dungarpur district (0.084) had the lowest food availability in Rajasthan. The cross-indicators analysis between the Baran (1st rank) and Durgapur (33rd rank) districts revealed that the per capita availability of food grains, oilseeds, condiments and spices, vegetables and fruits, milk, and eggs were relatively higher in the Baran district than the Durgapur district (Table 2). The per capita availability of food grains in the Baran district was 365.64 kg/year, while in the Durgapur district, it was only 108.98 kg/year. Likewise, the per capita availability of oilseeds in the Baran district was 321.16 kg/year, while it was only 1.46 kg/year in the Durgapur district. The per capita availability of condiments and spices was 107.17 kg/year in the Baran district, while it was only 0.14 kg/year in the Durgapur district. The per capita availability of vegetables and fruits was 0.51 kg/year in the Baran district, while it was 0.07 kg/year in the Durgapur district. The per capita availability of milk was 0.20 liter/day in the Baran district, while it was 0.13 liter/day in the Durgapur district. In totality, there is wide inter-linkage inequality among the districts in terms of food availability. The possible reasons for inequalities are: (i) inadequate accessibility of water has key factor responsible for inequality in agriculture production, (ii) due to less water for agriculture, farmers are less willing to grow water-intensive crops like wheat and rice, and (iii) farmers are also less willing to own livestock which ultimately reduces milk and egg production.
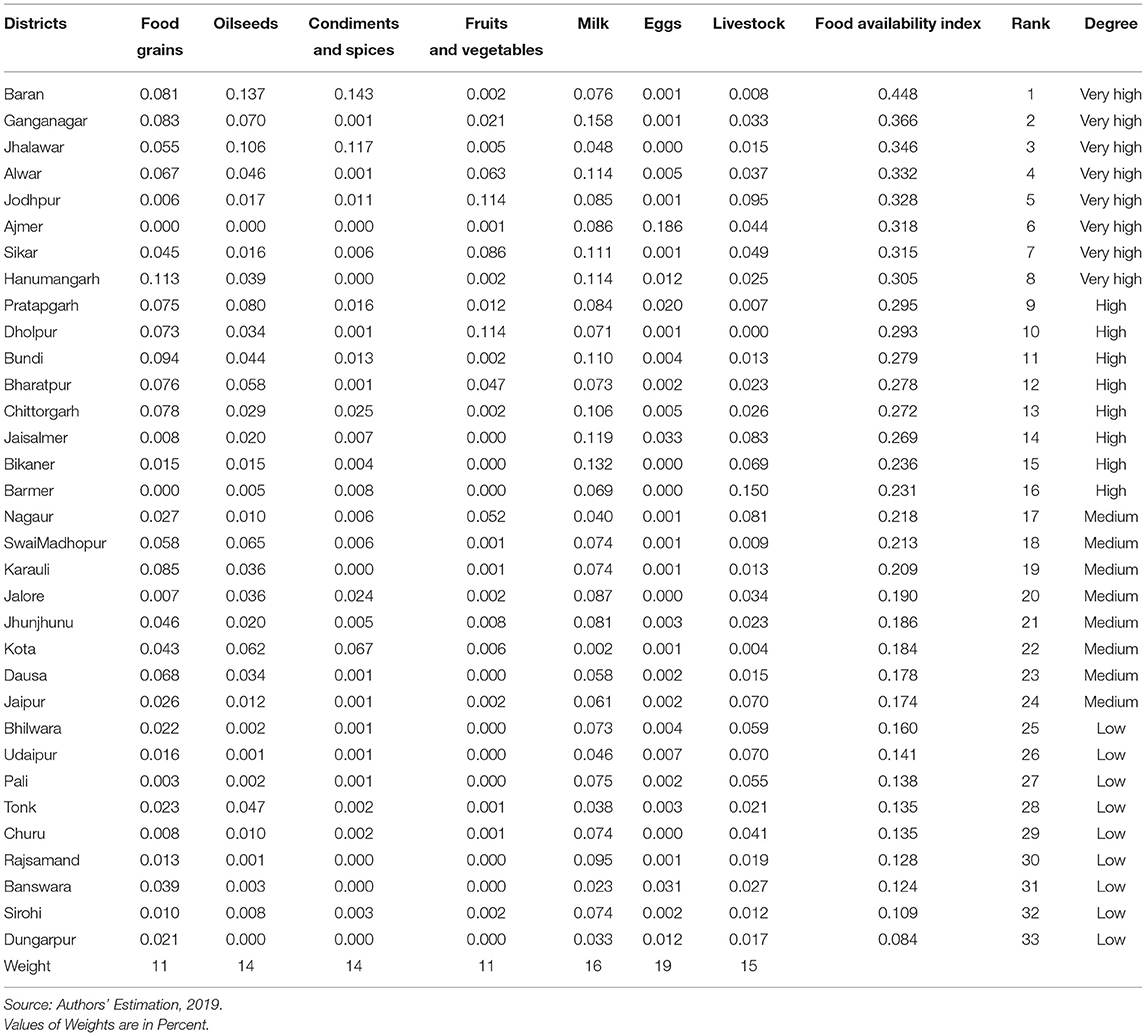
Table 2. District wise Food availability index for Rajasthan.
Food Accessibility Index
In terms of accessibility, the Jaipur (0.725), Kota (0.574), and Jodhpur (0.547) districts secured first, second, and third positions in terms of food accessibility on account of higher per capita district domestic product, literacy rate, and urbanization. Conversely, the Jalore district, with an index score of 0.132, was ranked lowest due to low literacy rates, slower growth in urban populations, and lower per capita income (Table 3). The cross-indicator analysis revealed that the Jaipur district has relatively higher accessibility to public services including public roads. The literacy rate of the Jaipur district was 75.51%, while it was only 54.86% in Jalore. The public and private road length in the Jaipur district were 5,607 kilometers, while in the Jalore district, it was 3,520 kilometers. The per capita domestic product of the Jaipur district was 37,601 INR, while the Jalore district was 16,268 INR. About 52.51% of the population belonging to the Jaipur district lived in urban areas, while the corresponding value is only 8.30% for the Jalore district. This clearly reflects the inter-district inequality in literacy rate, per capita GDP, road length, how the extent of urban and BPL populations induce the existence of huge variation in food accessibility across districts in Rajasthan.
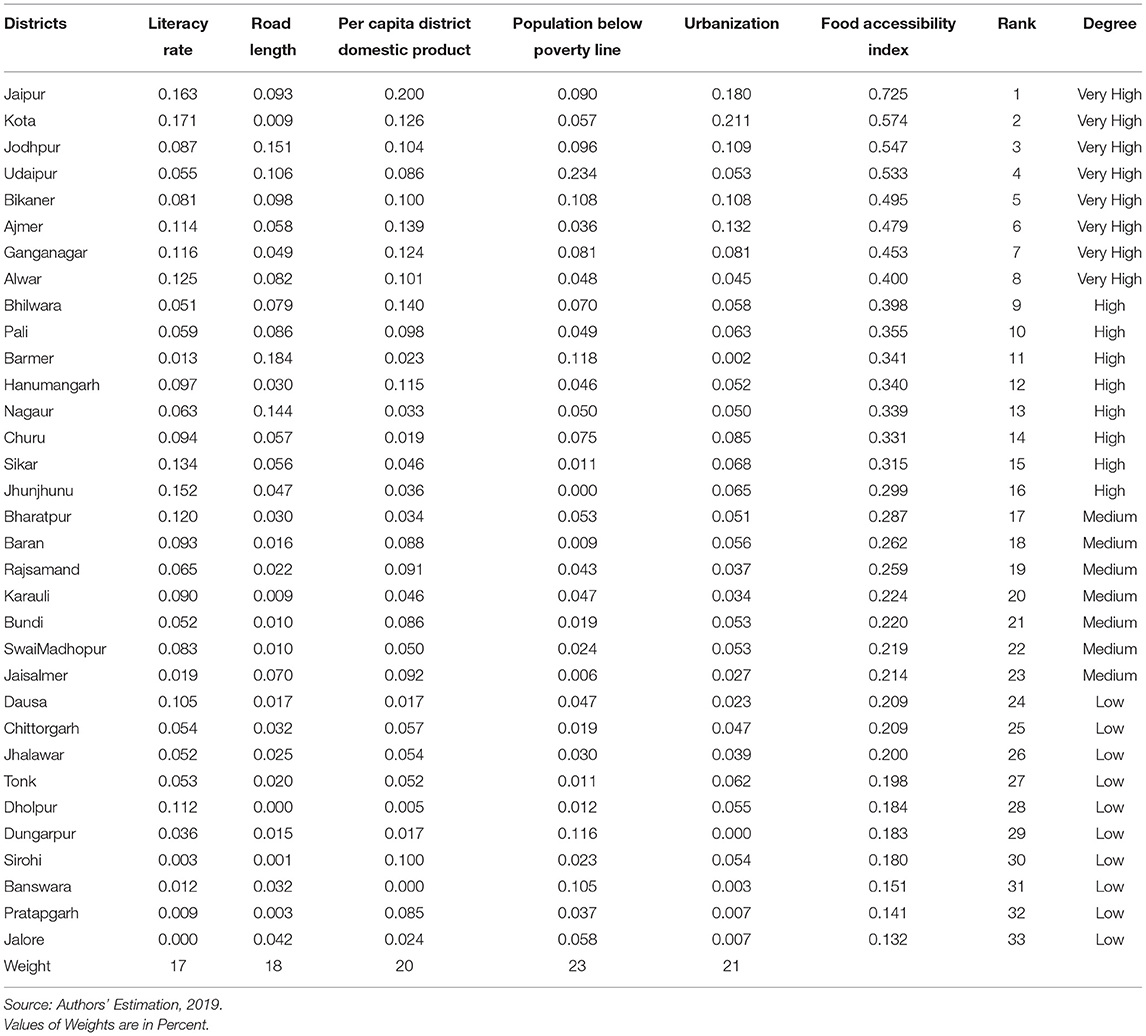
Table 3. District wise Food accessibility index for Rajasthan.
Food Stability Index
Based on the food stability index scores, it was found that the Jaipur district (0.725) had the highest food stability followed by the Kota district (0.574) and the Jodhpur district (0.547) (Table 4). Better storage capacity, followed by higher irrigated area and yield of food grains, were the major indicators that accounted for higher food stability in the Jaipur district. Conversely, the districts with relatively low food stability were the Jalore district followed by the Pratapgarh, Banswara, and Sirohi districts. The cross-sectional analysis of indicators belonging to food stability revealed that fertilizer consumption, the yield of food grains, storage capacity, cropping intensity, and gross irrigated area were relatively higher in the Jaipur district than those of Jalore (Table 4). Per hectare, fertilizer consumption was 71 kilograms in the Jaipur district, while it was only 8 kilograms in the Jalore district. The yield of food grains was 2113.67 kilograms/hectare in the Jaipur district, while it was only 36.36 kilograms/hectare in the Jalore district. The storage capacity for agricultural production was 151,520 metric tons in the Jaipur district, while it was only 5,400 metric tons in the Jalore district. Similarly, the cropping intensity of the Jaipur district was 143%, while it was only 109% in the Jalore district. Lastly, the percentage of gross irrigated area to the gross sown area was 83.70% in the Jaipur district, while it was only 14.81% in te Jalore district. In totality, there is wide variation in the food stability across the districts in Rajasthan. The possible reasons for inequalities are first, variation in rainfall is a key determining factor for per hectare agriculture yield. Districts belonging to the dry region are adversely affected due to less rainfall and face constraints to grow water-intensive cash crops such as wheat, rice, and sugarcane, while irrigated districts such as Jaipur, Ganganagar and Hanumangarh are less vulnerable and have sufficient water resources to grow such crops. Second, the fertility of soil also determines the fertilizer consumption and cropping pattern. Dry districts such as Bikaner, Udaipur, and Jaisalmer have relatively less fertile land than areas belonging to irrigated districts such as Jaipur, Ganganagar, Hanumangarh, and Kota.
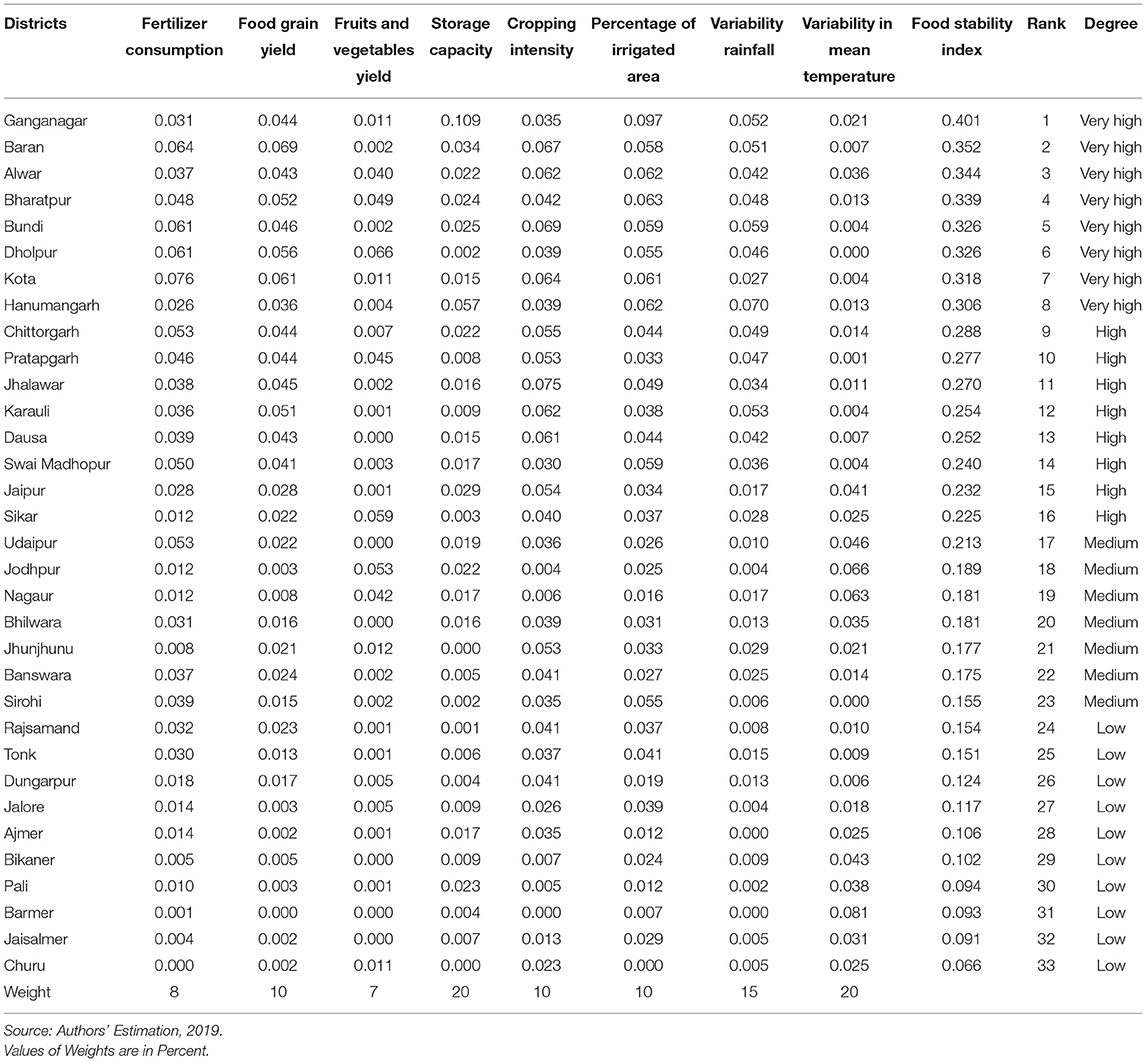
Table 4. District wise Food stability index for Rajasthan.
Food Security Index
The FSI was estimated as an aggregation of three indices (availability, accessibility, and stability). It was found that Ganganagar district (0.407) was rated the most food-secure district due to relatively higher food stability (0.401) in the Rajasthan state. Conversely, lower food availability (0.084) and accessibility (0.183) contributed to the lowest food security in the Dungarpur district (Table 5).
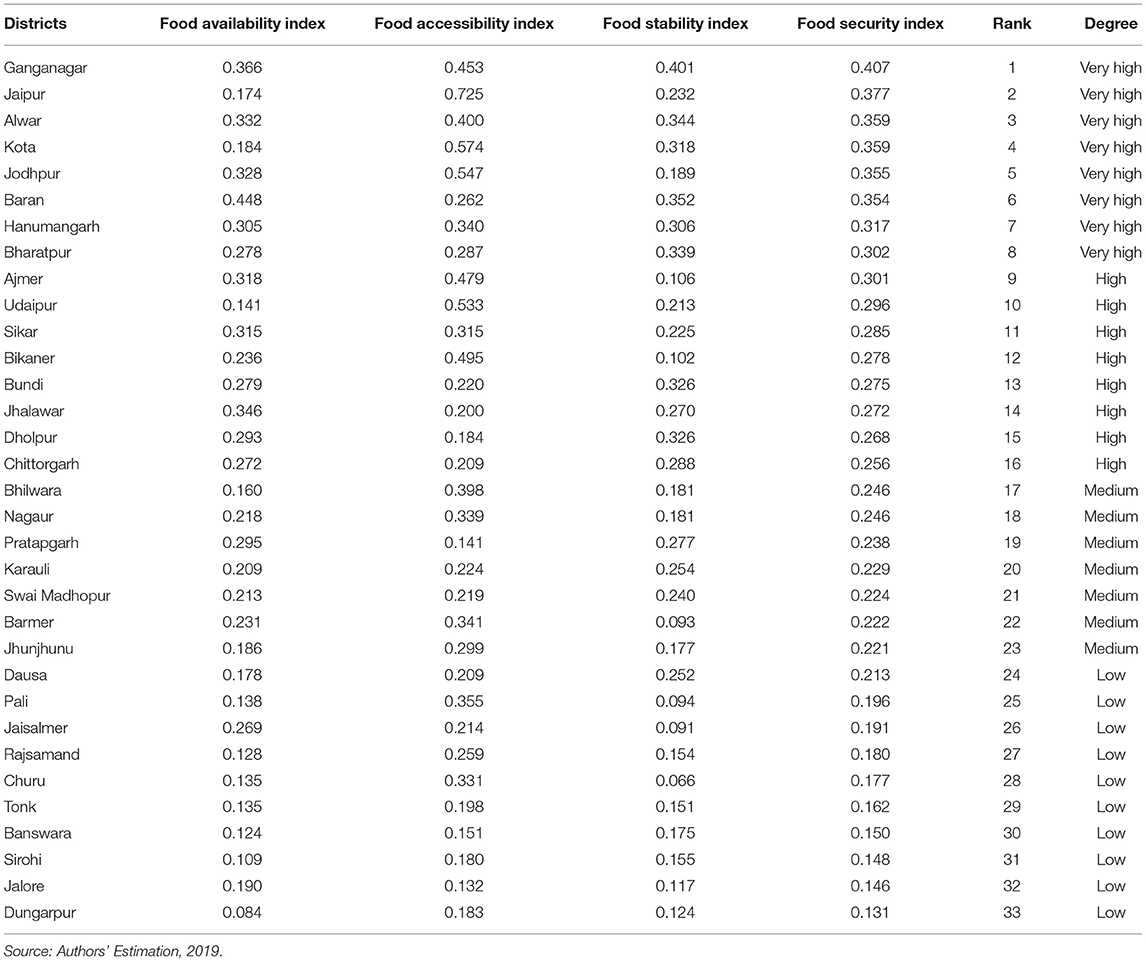
Table 5. District wise Food security index for Rajasthan.
Group Wise Food Security Index
The quintile estimation technique was used to evaluate food security status at the disaggregate level. Based on the quintile values, districts are grouped into four groups: low, medium, high, and very high (Figures 2A–D). As far as the food availability index is concerned, districts belonging to the desert region relatively had lower food availability, while districts belonging to the irrigated regions relatively had higher food availability (Figure 2A). Further, food accessibility quintile estimation results show that districts (i.e., Kota, Jodhpur, Udaipur, and Ajmer) of relatively higher urbanization rate, with 24/7 all seasonal road connectivity and proximity to the capital city of Jaipur, had higher food accessibility, while districts belonging to the desert region had relatively lower food accessibility capacity (Figure 2B). Furthermore, food stability is directly related to a higher yield of food grains, fruits and vegetables, and higher cropping intensity, hence, irrigated districts such as Ganganagar, Kota, Bharatpur, and Alwar had a relatively higher food stability than that of other districts (Figure 2C). In totality, districts that had the relative advantage of cropping intensity, the yield of crops, and all seasonal roads are relatively better off in terms of food security than that of other districts (Figure 2D).
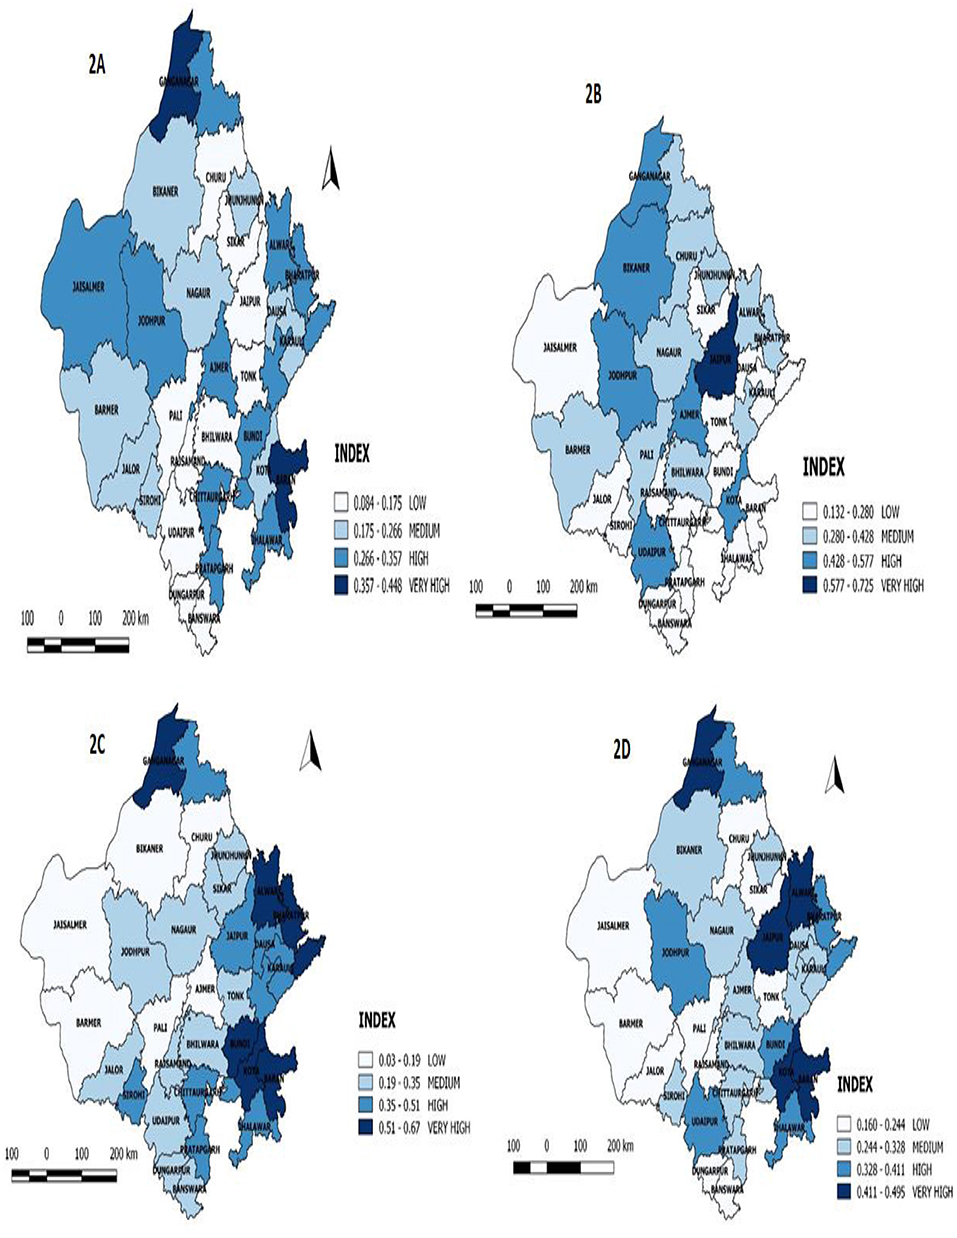
Figure 2. (A–D) are stands for Food availability index, food accessibility index, food stability index and food security index.
Validation of Estimated District-Wise Food Security Index
It is prerequisite to validate the constructed indices. It can be referred to as “good” when it is significantly correlates with its associate indices (Kumar et al., 2015; Singh and Nayak, 2020). Spearman's correlation coefficients reveal that FSI is positively associated with FAVI, FACI, and FSTI (Table 6). This strongly reflects that food security depends on food availability, accessibility, and stability and also has a significant association with its components. Food availability is positively associated with food stability. It infers that food stability improves as food production increases.
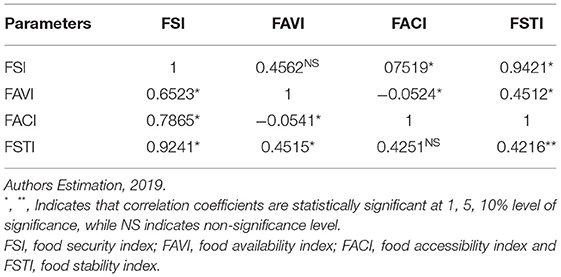
Table 6. Spearman's rank correlation statistics.
Empirical Findings
By using the OLS method and the hypothetical assumption mentioned in equations 7, 8 and 9, the FSI is regressed with its components. The regression classification Table 7 indicates that the OLS correctly predicted about 90% (i.e., R2 value). The model fits the data at (p < 0.001) as indicated by the F probability statistics (Prob > F). This reflects that results also reject the null hypotheses and accept alternative hypothesis stating a significant relationship between the captured variables and food security index. Further, the goodness of fit (R2) demonstrated that the variables used in this study were sufficient in capturing the variation due to their respective dependent variables (Singh, 2020a,b).
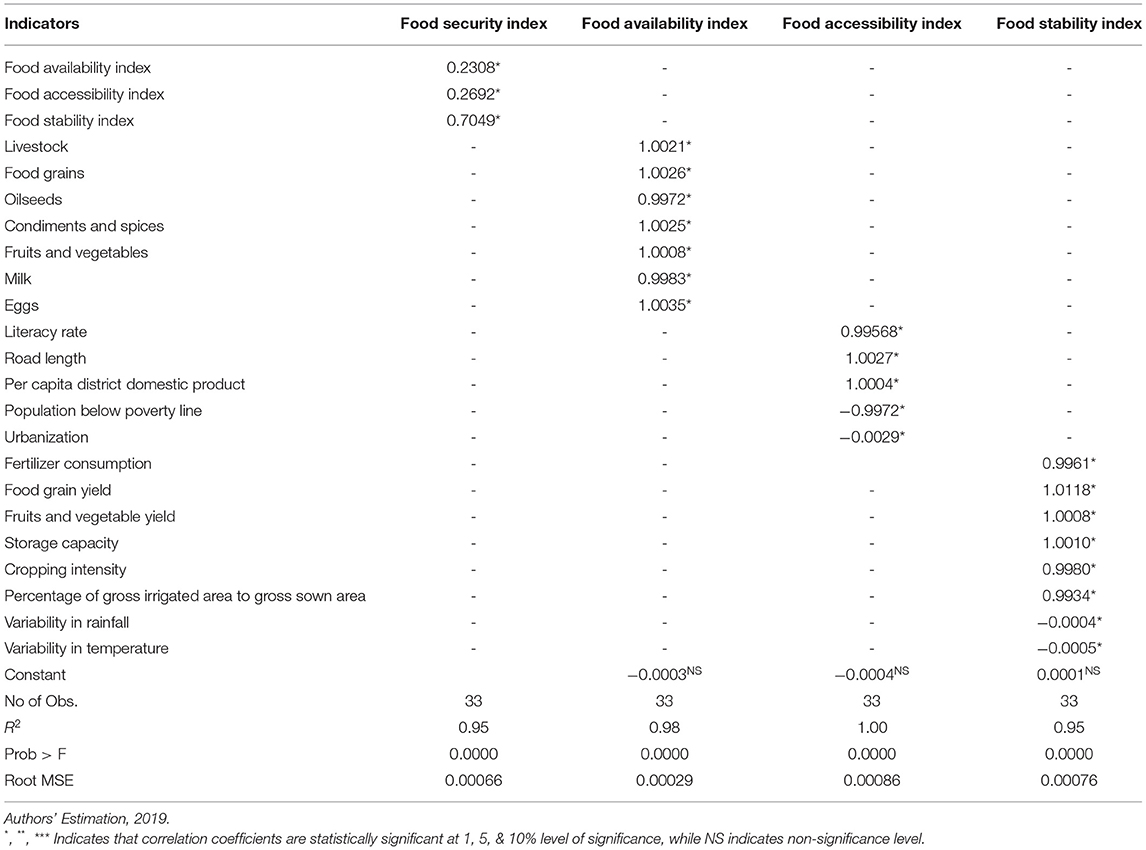
Table 7. Impact of different factors on food security, food availability, food accessibility, and food stability in Rajasthan.
Table 7 reveals regression results among food security and its components. The components of food security such as availability, accessibility, and stability are regressed on the FSI to estimate their individual impact. Results show that all the components are positively and significantly associated with the FSI, which is theoretically correct and valid. Our results also matched with Dev and Sharma (2010) with an argument that any increase in availability, accessibility, and stability leads to better food security. Further, the food availability index also regressed with its associated components. Regression results show that all components are statistically and positively associated with the food availability index. Results show that increase in the availability of livestock, food grains, oilseeds, condiments and spices, fruits and vegetables, milk and eggs leads to an increase first, in nutritional security, then, eventually food security in the study districts of Rajasthan. Furthermore, literacy rate, road length, per capita domestic product, BPL population, and urbanization rate are regressed with food accessibility components. Regression results confirm that all the components are positively associated with the food accessibility index except the population below the poverty line and the urbanization rate. It means that an increase in literacy rate, along with the accessibility of all seasonal roads, and per capita district domestic product, leads to an increase in food accessibility. Conversely, an increase in the BPL population and urbanization rate leads to a decline in food accessibility. Moreover, components such as fertilizer consumption, yield of food grains, fruits and vegetables, storage capacity, cropping intensity, irrigated area, variability in rainfall, and temperature are regressed with the food stability index. The regression result shows that all the components are positively associated with the food stability index except variability in rainfall and temperature. It means an increase in fertilizer consumption (bio and chemical), yield of food grains, fruits and vegetables, storage capacity, cropping intensity, and irrigated area leads to higher food stability, while increase in variability in rainfall and temperature leads to a decline in food stability.
Discussion
This study used disaggregate-level data to examine the extent and dimensions of food security at the district-level using the indicator approach and secondary data. The study argued that India is a diverse and complex society which has geographical conditions. Hence, disaggregate-level analysis is imperative to capture regional variations. The majority of previous studies have used similar indicators at the country and state-level but none of the them exclusively captured regional aspects of food security in Rajasthan. The findings from this study revealed that there were large-scale variations in the values of indices calculated from different districts in all three dimensions of food security, i.e., accessibility, availability, and stability. Second, socio-economic factors along with access to extension services are at center of food security. Hence, we cannot ignore the relative importance of these factors apart from agricultural production. These results are perfectly matched with Mahadevan and Sandy (2013). Their study evidenced that food security is being adversely affected in households particularly from the low caste groups or belonging to a religious minority. Further, food availability and stability indices were calculated by using food production and population data. District-level data of food production has shown that districts belonging to dry regions are relatively more food insecure compared to districts belonging to irrigated regions. This is increasing rural-urban migration and would adversely affect the economy and infrastructure of urbanized districts such as Jaipur, Kota, and Ajmer. This also would be the main obstacle in achieving “Zero Hunger” target, which is part of the sustainable development goals by 2030 as India committed to the United Nations. Furthermore, population growth data as per population Census (2011) revealed that the population of Rajasthan increased by 7.1% during 2001–11 and is expected to further increase by 6% in 2021 (Census, 2011). Hence, the demand for food items would increase in the coming years. Thus, the increasing demand for food necessitates large-scale agricultural intensification to meet the future need of food. The extensive increase in agriculture production will have a positive impact on reducing hunger. However, an increase in food production induces intensive resource utilization to meet the primary raw material requirements in the agriculture sector. As part of the sustainable development agenda, balancing the trade-off between resource and environmental conservation along with food demand is of the utmost importance.
The present study provides solutions for arresting food insecurity at the regional level (Figure 3) using 3D framework (Vuong et al., 2022). The framework is appropriate and practical on the individual, organizational, and national levels within different contexts. This paper employed it to explain how food security ensured global, national, and regional scale. Conceptually, the 3D framework has three major components: (1) increased food availability through crop diversification and food production along with efficient food market, (2) increased food accessibility by increasing number of fair price shops, literacy, and income diversification, and (3) increased food stocks and relatively less dependence on climatic factors.
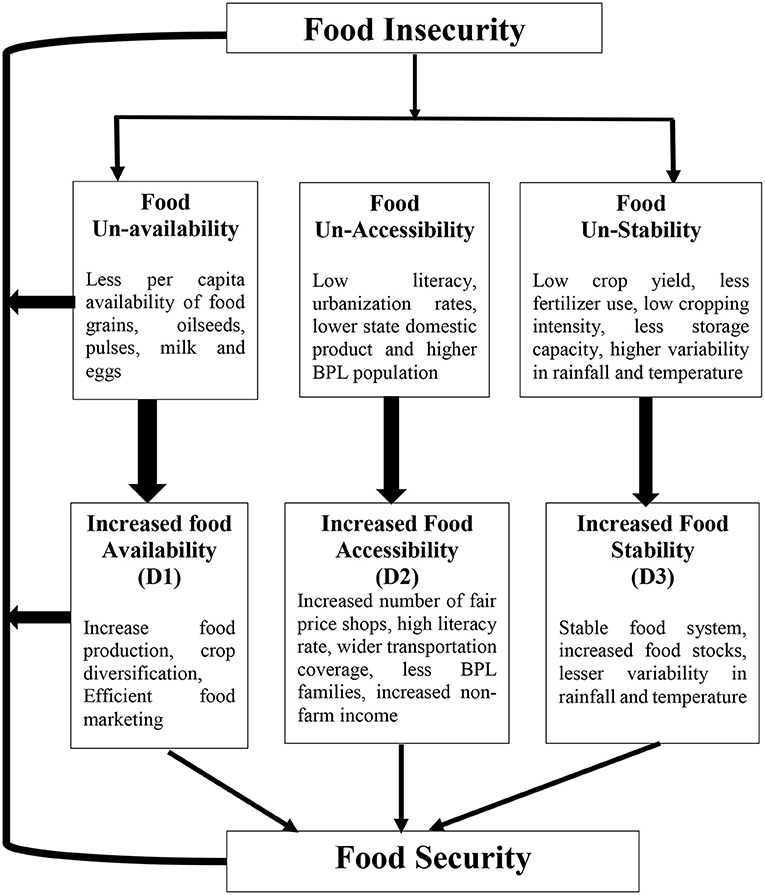
Figure 3. 3D Framework for Regional Food Security Assessment. Source: Author's estimation, 2019.
The present study finds that lower food availability and accessibility are major components for higher food instability which lead to food insecurity in the districts associated with the dry state of India viz., Rajasthan. Hence, if farmers increased their food production by employing ultra-modern artificial intelligence technology then food availability will increase (Singh and Nayak, 2014, 2018a). Further, higher fair-price shops along with wider transportation coverage have ensured a continuous supply of food products even in remote areas and will help to reduce food inequality. Lastly, agricultural and food production systems play an essential role in increasing the food supply. Improved outlook on agriculture's main issues and the food system, founded on the strong evidence base, can lead to accelerated progress in achieving regional food security.
The contribution of the present study in the academic is as follows. First, the present study provides a conceptual framework that lays out the multiple dimensions, level, and components of food security at disaggregated-level. Second, for each of the identified indicators of food security, we systematically review their original purpose and construction, what underlying construct(s) they were intended, i.e., whether they reliably and accurately reflect the underlying phenomenon they were intended to reflect. Lastly, the present study mapped each indicator according to the level of measurement and the component(s) of food security access it captures and highlights the strengths and weaknesses of the evidence.
Conclusion and Policy Implication
The study attempted to assess the food security status of different districts in Rajasthan, which facilitated in identifying and prioritizing the food insecure regions and the corresponding socio-economic factors that contributed to such inefficiency and vulnerability. The results revealed significant inter-district variations across the three major dimensions of food security: availability, accessibility, and stability. Districts belonging to the dry regions are relatively higher food insecure compared to the districts belonging to the irrigated regions. Index validation results show that all three components of food security are positively and significantly associated with the food security. Further, empirical regression results confirm that variability in rainfall and temperatures are negatively associated with the FSI indicating that any change in rainfall and temperature can lead to lower food security in the dry districts. Furthermore, the population belonging to the below poverty line are also relatively more food insecure than that of the population belonging to the above poverty line. It also further indicates that rural development programmes such as MGNREGA have played a vital role in promoting food insecure districts into food secure districts. Rapid urbanization in irrigated districts has led to better food security compared to dry regions. Moreover, quintile estimation results portray that lower food production and inadequate market access in districts, namely Dungarpur, Jalore, and Churu, fall into the low food security category. Hence, lower food accessibility reflects the need to increase the literacy rate for not only improving the access but also to promote an increase in the adoption of better farm technologies.
Hence, this study recommends the following policy suggestions. First, increasing climate aberrations significantly impact rural/agro-based livelihood and diversification from farm to non-farm activities helps moderate vulnerability to livelihood shocks. Secondly, sufficient storage capacity needs to be created to avoid possible wastage in the harvesting season and price fluctuation across seasons. Thirdly, focus needs to be made on the development and dissemination of climate-resilient technologies, investment in infrastructure, promotion of water management, conservation technologies, and regulation and replenishment of groundwater in rural areas for augmenting cropping intensity. Fourthly, there is a dire need for district-specific policies to arrest food insecurity in backward districts. Fifth, migration from rural areas to urban centers is increasing stress on the urban resources, therefore, coverage of rural employment programmes could be increased to urban areas to ensure employment opportunities in both rural and urban areas.
Though this study tried to capture all the aspects of food security and highlighted the constraints of food security at district level in Rajasthan, the results need to be interpreted with caution because of certain limitations. Firstly, the present study has only used spatial data to map the food security status of districts in Rajasthan by excluding temporal variations due to data constraints, while from the policy perspective, it is imperative to capture spatial-temporal variability in food security. Secondly, unemployment and poverty are also key factors responsible for food insecurity especially in dry districts such as Jodhpur, Bikaner, and Ajmer. Data for employment and poverty was collected only in the 68th NSSO round (2012–13), which is not comparable with current data. Hence, this study has excluded unemployment and poverty aspects from the analysis. Thirdly, the present study has identified that districts belonging to the dry regions are relatively more food insecure compared to districts belonging to the irrigated regions. Hence, it is also important to assess regional-specific food security status, while the present study excluded this dimension. Finally, Indian society is divided based on castes, classes, religions, regions, and many stratifies, hence, it generates scope for future research on food security along with rational indicators and estimation methods.
Data Availability Statement
The raw data supporting the conclusions of this article will be made available by the authors, without undue reservation.
Author Contributions
All authors contributed to the conceptualization and design of this study. SSJ collected data and analyzed it, SN collected literature and reviewed it, and NPS and KN drafted the manuscript. All authors contributed to the article and approved the submitted version.
Conflict of Interest
The authors declare that the research was conducted in the absence of any commercial or financial relationships that could be construed as a potential conflict of interest.
Publisher's Note
All claims expressed in this article are solely those of the authors and do not necessarily represent those of their affiliated organizations, or those of the publisher, the editors and the reviewers. Any product that may be evaluated in this article, or claim that may be made by its manufacturer, is not guaranteed or endorsed by the publisher.
Acknowledgments
The authors are thankful to the Bhawna Anand for their valuable suggestions and improvement of the previous draft of this article. The authors are also thankful to the director ICAR-National Institute of Agricultural Economics and Policy Research, New Delhi, India for their valuable suggestions and encouragement to undertake this study.
References
Acharya, S. S. (2006). Sustainable agriculture and rural livelihoods. Agric. Econ. Res. Rev. 19, 205–217. doi: 10.22004/ag.econ.57758
Adger, W. N. (2000). Social and ecological resilience: are they related. Prog. Hum. Geogr. 24, 347–364. doi: 10.1191/030913200701540465
Aggarwal, P. K., and Sivakumar, M. V. K. (2010). “Global Climate Change and Food Security in South Asia: An Adaptation and Mitigation Framework,” in Climate Change and Food Security in South Asia, eds R. Lal, M. V. K. Sivakumar, S. M. A. Faiz, A. H. M. Mustafizur Rahman and K. R. Islam (Springer: Dordrecht), 253–275. doi: 10.1007/978-90-481-9516-9_16
Alexandratos, N., and Bruinsma, J. (2012). “World Agriculture towards 2030/2050: The Revision. ESA Working Paper Rome. FAO.
Auffhammer, M., Ramanathan, V., and Vincent, J. R. (2012). Climate change, the monsoon, and rice yield in India. Clim. Change 111, 411–424. doi: 10.1007/s10584-011-0208-4
Barrett, C. B. (2010). Measuring food insecurity. Science 327, 825–828. doi: 10.1126/science.1182768
Bizimana, J-C., Richardson, J. W., and Clarke, N. P. (2020). Household Food Security and Nutrition Analysis Using a Farm Simulation Model (FARMSIM): case study of robit in Amhara Region, Ethiopia”. ES Food Agroforest. 2, 22–41. doi: 10.30919/esfaf1113
Broussard, N., and Sharad, T. (2016). Food Insecurity Measures: Experience-Based Versus Nutrition-Based Evidence From India, Bangladesh, and Ethiopia. Economic Research Report No. ERR-220, United State Department of Agriculture, United State, 1–46.
Census (2011). District Abstract. Office of the Registrar General & CensusCommissioner, India, Ministry of Home Affairs, Government of India, New Delhi.
Central Ground Water Board (2017). Ground Water Year Book 2016–2017 Rajasthan State. Ministry of Water Resources, River Development and Ganga Rejuvenation, Government of India, New Delhi.
Chen, P. –C., Ming-Miin, Y., Jou-Chen, S., Ching-Cheng, C., and Shih-Hsun, H. (2019). Assessment of the Global Food Security Index by using a hierarchical data envelopment analysis approach. Eur. J. Oper. Res. 272, 687–698. doi: 10.1016/j.ejor.2018.06.045
Clay, E. (2002). “Food Security: Concepts and Measurement”, Paper for FAO Expert Consultation on Trade and Food Security: Conceptualising the Linkages Rome, 11–12 July. Published as Chapter 2 of Trade Reforms and Food Security: conceptualising the linkages. Rome.
Dev, S. M., and Sharma, A. N. (2010). Food Security in India: Performance, Challenges and Policies. Oxfam India, OIWPS-VII.
DoES, (2019). Statistical Abstract 2019. Directorate of Economics and Statistics, Department of Planning, Government of Rajasthan, India.
Dorin, B., and Le Cotty, T. (2014). “Agribiom: a tool for scenario-building and hybrid modelling,” in Agrimonde-Scenarios and Challenges for Feeding the World in 2050, eds S. Paillard, S. Treyer, B. Dorin, editors (Springer: Dordrecht), 9–35. doi: 10.1007/978-94-017-8745-1_2
FAO (2006). Food and Agricultural Organization of the United Nations (FAO) Agriculture and Development Economics Division. Policy Brief, Rome.
FAO. (1996). World Food Summit. Rome Declaration on World Food Security”. Food and Agricultural Organization, Rome.
FAO. (2008). Climate Change and Food Security: A Framework Document. Food and Agricultural Organization of the United Nations (FAO), Rome.
FAO. (2018). The State of Food Security and Nutrition in the World 2018. Building Climate Resilience for Food Security and Nutrition, the State of Food Security and Nutrition in the World. FAO, Rome.
Farrukh, M. U., Bashir, M. K., Hassan, S., Adil, S. A., and Kragt, M. E. (2020a). Mapping the food security studies in India, Pakistan and Bangladesh: review of research priorities and gaps. Glob. Food Secur. 26:100370. doi: 10.1016/j.gfs.2020.100370
Farrukh, M. U., Bashir, M. K., and Rola Rubzen, F. (2020b). Exploring the sustainable food security approach in relation to agricultural and multi-sectoral interventions: A review of cross-disciplinary perspectives. Geo-forum 108, 23–27. doi: 10.1016/j.geoforum.2019.11.012
Fischer, G., Hizsnyik, E., Sylvia, P., Shah, M., and van Harry, V. (2009). Biofuels and Food Security. OFID study prepared by IIASA.
Food and Nutrition Security Analysis. (2019). “Food and Nutrition Security Analysis” Ministry of Statistics and Programme Implementation. The World Food Programme, New Delhi.
GoI. (2017). Agricultural Statistics at a Glance. Ministry of Agriculture and Farmers Welfare Department of Agriculture, Cooperation and Farmers Welfare, Directorate of Economics and Statistic, New Delhi, India.
GoI. (2019). Agricultural Statistics at a Glance. Ministry of Agriculture and Farmers Welfare Department of Agriculture, Cooperation and Farmers Welfare, Directorate of Economics and Statistic, New Delhi, India. Available online at: https://eands.dacnet.nic.in/PDF/At%20a%20Glance%202019%20Eng.pdf
Gopalakrishnan, R., Jayaraman, M., and Ravindranath, N. H. (2011). Regional Climate Modeling results for Rajasthan state. Presented at the Workshop, Science-Based Policy Options for Climate Change Adaptation in Rajasthan (2011). Organized by Rajasthan state pollution control Board, Jaipur, Rajasthan.
Gross, R., Schoeneberger, H., Pfeifer, H., and Preuss, H. J. A. (2000). The Four Dimensions of Food and Nutrition Security: Definitions and Concept. Nutrition and Food Security.
Guiteras, R. (2009). The Impact of Climate Change on Indian Agriculture. Department of Economics, University of Maryland, College Park, Maryland.
Gupta, A., and Mishra, D. K. (2020). Measuring food security through dietary diversity: insights from a Field Survey in Rural Uttar Pradesh, India. Indian Econ. J. 66, 347–364. doi: 10.1177/0019466220922386
Haysom, G., and Tawodzera, G. (2018). Measurement drives diagnosis and response: gaps in transferring food security assessment to the urban scale. Food Policy 74, 117–125. doi: 10.1016/j.foodpol.2017.12.001
Ibok, O. W., Osbahr, H., and Srinivasan, C. (2019). Advancing a new index for measuring household vulnerability to food insecurity. Food Policy 84, 10–20. doi: 10.1016/j.foodpol.2019.01.011
IMD (2015). Annual Report, Indian Meteorological Department of India. Ministry of Earth Science, Government of India, New Delhi, India.
International Institute for Population Sciences (IIPS) and ICF (2017). National Family Health Survey (NFHS-4), 2015–2016, India.
IPCC (2018). “Summary for Policymakers,” in Global Warming of 1.5°C, eds V. Masson-Delmotte, P. Zhai, H.-O. Pörtner, D. Roberts, J. Skea, P.R. Shukla, A. Pirani, W. Moufouma-Okia, C. Péan, R. Pidcock, S. Connors, J.B.R. Matthews, Y. Chen, X. Zhou, M.I. Gomis, E. Lonnoy, T. Maycock, M. Tignor, and T. Waterfield (Geneva: World Meteorological Organization), 32.
Iyengar, N. S., and Sudarshan, P. (1982). A method of classifying regions from multivariate data. Econ. Polit. Wkly. 17, 2047–2052.
Jatav, S. S. (2021). Does India achieve agenda 2030 targets: a multiple lens analysis. Indian J. Ecol. 48, 1230–1245.
Jatav, S. S., Kumar, A., and Malik, B. B. (2021a). Impact of Covid-19 on the livelihood of rural farmers in Uttar Pradesh, India. J. Rural Dev. 40, 94–11. doi: 10.25175/jrd/2021/v40/i1/166505
Jatav, S. S., Surendra, M., Sanatan, N., and Sonali, N. (2021b). Coping to Covid-19 in Uttar Pradesh, India: evidence from NSSO 76th Round Data. Curr. Urban Stud. 9, 206–217. doi: 10.4236/cus.2021.92013
Jensen, R. T., and Nolan, H. M. (2010). A Revealed Preference Approach to Measuring Hunger and Under-Nutrition. NBER Working Paper Series, National Bureau of Economic Research, U.K. 1-31. doi: 10.3386/w16555
Jha, R., Raghav, G., and Manoj, K. P. (2013). Body Mass Index, participation, duration of work and earnings under National Rural Employment Guarantee Scheme: evidence from Rajasthan. J. Asian Econ. 26, 14–30. doi: 10.1016/j.asieco.2013.03.001
Jones, M. R., Singels, A., and Ruane, A. C. (2013). Simulated impacts of climate change on water use and yield of irrigated sugarcane in South Africa. Proc. S. Afr. Sugar Technol. Assoc. 86, 184–189. doi: 10.1016/j.agsy.2015.07.007
Krishnamurthy, P. K., Lewis, K., and Choularton, R. J. (2012). Climate Impacts on Food Security and Nutrition—A Review of Existing Knowledge” Met Office and WFP's Office for Climate Change. Environment and Disaster Risk Reduction: Exeter (2012).
Krishnamurthy, P. K., Lewis, K., and Choularton, R. J. (2014). A methodological framework for rapidly assessing the impacts of climate risk on national-level food security through a vulnerability index. Glob. Environ. Change 25, 121–132. doi: 10.1016/j.gloenvcha.2013.11.004
Kumar, A., Sharma, P., and Ambrammal, S. K. (2015). Effects of climatic factors on productivity of cash crops in India: evidence from state-wise panel data. Glob. J. Res. Soc. Sci. 1, 9–18.
Kumar, S., Raizada, A., Biswas, H., Srinivas, S., and Mondal, B. (2016). Application of indicators for identifying climate change vulnerable areas in semi-arid regions of India. Ecol. Indic. 70, 507–517. doi: 10.1016/j.ecolind.2016.06.041
Madani, K., Darch, G., Parra, F., and Workman, M. (2015). Using Game Theory to Address Modern Resource Management Problems. Grantham Institute, Imperial College London, 6.
Mahadevan, R., and Sandy, S. (2013). Is there a role for caste and religion in food security policy? A look at rural India. Econ. Model. 31, 58–69. doi: 10.1016/j.econmod.2012.11.060
Mall, R. K., Singh, R., Gupta, A., Srinivasan, G., and Rathore, L. S. (2006). Impact of climate change on Indian agriculture: a review. Clim. Change 78, 445–478. doi: 10.1007/s10584-005-9042-x
Maxwell, D., Vaitla, B., and Coates, J. (2014). How do indicators of household food insecurity measure up? An empirical comparison from Ethiopia. Food Policy 47, 107–116. doi: 10.1016/j.foodpol.2014.04.003
Mondal, P., Jain, M., DeFries, R. S., Galford, G. L., and Small, C. (2015). Sensitivity of crop cover to climate variability: Insights from two Indian agro-ecoregions. J. Environ. Manag. 148, 21–30. doi: 10.1016/j.jenvman.2014.02.026
Namany, S., Rajesh, G., Luluwah, A., Gordon, M., and Al Tareq, A. (2020). Sustainable food security decision-making: an agent-based modelling approach. J. Cleaner Prod. 255:120296. doi: 10.1016/j.jclepro.2020.120296
National Intelligence Council India (2009). “Impact of Climate Change to 2030-A Commissioned Research Report” National Intelligence Council: New Delhi, India (2009).
Nayak, S., and Surendra, S. (2020). Development of gender sensitive vulnerability index for urban Indian Slums. Indian J. Tradit. Knowl. 19, 592–597.
OECD (2008). Handbook on Constructing Composite Indicators: Methodology and User Guide. Organization for Economic Cooperation and Development, France, 1–165. doi: 10.1787/9789264043466-en
Payne, H. E., Bobbi, G., Siena, F. D., Cassidy, A. H., Arindam, D., Manisha, K., et al. (2016). Factors associated with food insecurity among women and children in rural Rajasthan, India. J. Gend. Agric. Food Secur. 1, 23–39. doi: 10.22004/ag.econ.253135
Planning Commission (2012). Final Report of Minor Irrigation and Watershed Management for the Twelfth Five Year Plan (2012–2017). Government of India: New Delhi, India 3–4.
Poudel, D., and Munisamy, G. (2021). Exploring the disparity in global food security indicators. Glob. Food Secur. 29, 1–12. doi: 10.1016/j.gfs.2021.100549
Raghuvanshi, A. K., and Smita, G. (2015). Food insecurity in Rajasthan: causes and proportions. Int. J. Econ. Bus. Rev. 3, 1–6.
Sam, A. S., Azhar, A., Subhash, S. P., Archana, R. S., Dhanya, V., Harald, K., et al. (2021). Flood Vulnerability and food security in eastern India: a threat to the achievement of the Sustainable Development Goals. Int. J. Disaster Risk Reduct. 66:102589. doi: 10.1016/j.ijdrr.2021.102589
Sanghi, A., and Mendelsohn, R. (2008). The impacts of global warming on farmers in Brazil and India. Glob. Environ. Change 18, 655–665. doi: 10.1016/j.gloenvcha.2008.06.008
Saxena, A., Arpita, A., Sanjana, B. M., and Pavitra, M. (2020). Food Insecurity in Tribal high migration communities in Rajasthan, India. Food Nutr. Bull. 41, 513–518. doi: 10.1177/0379572120967163
Sen, A. K. (1981). Ingredients of famine analysis: Availability and entitlements. Q. J. Econ. 96, 433–464. doi: 10.2307/1882681
Shakeel, A., and Zaidy, N. (2012). A regional analysis of food security in Bundelkhand region Uttar Pradesh (India). J. Geogr. Reg. Plann. 5, 252–262. doi: 10.5897/JGRP12.023
Shoaib, S. A., Mohammad, Z. K., Nahid, S., and Taufique, H. M. (2021). Quantifying uncertainty in food security modeling. Agriculture 11:33. doi: 10.3390/agriculture11010033
Singh, N. P., Bantilan, C., and Byjesh, K. (2014). Vulnerability and policy relevance to drought in the semi-arid tropics of Asia–A retrospective analysis. Weather Clim. Extreme 3, 54–61. doi: 10.1016/j.wace.2014.02.002
Singh, N. P., Singh, S., Anand, B., and Bal, S. K. (2019). Climate vulnerability assessment in semi-arid and arid region of Rajasthan, India: an enquiry into the disadvantaged districts. J. Agrometereol. 21, 197–202. doi: 10.54386/jam.v21i2.233
Singh, S. (2019). Soil health security in India: insights from soil health card data. Res. Rev. Int. J. Multidisciplinary 4, 56–70. doi: 10.5281/zenodo.2604071
Singh, S. (2020a). Farmers' perception of climate change and adaptation decisions: a micro-level analysis of farmers in Bundelkhand Region. Ecol. Indic. 116:106475. doi: 10.1016/j.ecolind.2020.106475
Singh, S. (2020b). Bridging the gap between biophysical and social vulnerability in rural india: the community livelihood vulnerability approach. Area Dev. Policy 5, 390–411. doi: 10.1080/23792949.2020.1734473
Singh, S., and Alka, S. (2019). Escalating food security status in Gujarat state of India. Asian J. Multidimens. Res. 8, 12–28. doi: 10.5958/2278-4853.2019.00110.1
Singh, S., and Nayak, S. (2014). Climate change and agriculture production in India. Eur. Acad. Res. 2, 12–30.
Singh, S., and Nayak, S. (2018a). Land inequality and agricultural sustainability in Uttar Pradesh, India: a regional analysis. Asian J. Sci. Technol. 9, 12–32.
Singh, S., and Nayak, S. (2018b). Application of indicators for identifying climate vulnerable areas in sub-tropical regions of India. J. Multi. Dimen. Res. 7, 1–514. Available online at: https://tarj.in/wp-content/uploads/paper/AJMR/2018/AJMR-NOVEMBER-2018.pdf
Singh, S., and Nayak, S. (2020). Development of sustainable livelihood security index for different agro-climatic zones of Uttar Pradesh. J. Rural Dev. 39, 110–129. doi: 10.25175/jrd/2020/v39/i1/125991
Sinha, N., and Kulshrestha, S. K. (2012). Food availability and food security in Rajasthan: an application of random effect model. Arthshodh 4, 72–82.
Smith, M., Pointing, J., and Maxwell, S. (1993). Household Food Security, Concepts and Definitions; An Annotated Bibliography. Institute of Development Studies, UK.
Swati, R., and Arora, K. (2021). Measuring and mapping the state of food insecurity in Rajasthan, India. Geogr. Environ. Sustain. 14, 33–40. doi: 10.24057/2071-9388-2020-67
Tadesse, G., Gashaw, T. A., and Tadiwos, Z. (2020). Biases in self-reported food insecurity measurement: a list experiment approach. Food Policy 92:101862. doi: 10.1016/j.foodpol.2020.101862
Vaitla, B., Coates, J., Glaeser, L., Hillbruner, C., Biswal, P., and Maxwell, D. (2017). The measurement of household food security: correlation and latent variable analysis of alternative indicators in a large multi-country dataset. Food Policy 68, 193–205. doi: 10.1016/j.foodpol.2017.02.006
Venkateswarlu, B., and Singh, A. K. (2015). Climate change adaptation and mitigation strategies in rainfed agriculture,” in Climate Change Modelling, Planning and Policy for Agriculture, eds A. K. Singh, J. C. Dagar, A. R. G. Arunachalam, K. N. Shelat (Springer: New Delhi), 1–11. doi: 10.1007/978-81-322-2157-9_1
Vuong, Q. H., Tam, T. L., Viet-Phuong, L., Huyen, T. T. N., Manh-Toan, H., Quy, V. K., et al. (2022). Covid-19 vaccines production and societal immunization under the Serendipity-mondsponge- 3D knowledge management theory and conceptual framework. Humanit. Soc. Sci. Commun. 9, 1–12. doi: 10.1057/s41599-022-01034-6
Keywords: food security, indicators, OLS, index, regional heterogeneities, QGIS, India
Citation: Jatav SS, Nayak S, Singh NP and Naik K (2022) Measuring and Mapping Food Security Status of Rajasthan, India: A District-Level Analysis. Front. Sustain. Food Syst. 6:831396. doi: 10.3389/fsufs.2022.831396
Received: 08 December 2021; Accepted: 22 February 2022;
Published: 12 April 2022.
Edited by:
Quy Khuc, Vietnam National University, Hanoi, VietnamReviewed by:
Minh-Hoang Nguyen, Ritsumeikan Asia Pacific University, JapanTam-Tri Le, Phenikaa University, Vietnam
Hong Nguyen Van, Vietnam Academy of Science and Technology, Vietnam
Copyright © 2022 Jatav, Nayak, Singh and Naik. This is an open-access article distributed under the terms of the Creative Commons Attribution License (CC BY). The use, distribution or reproduction in other forums is permitted, provided the original author(s) and the copyright owner(s) are credited and that the original publication in this journal is cited, in accordance with accepted academic practice. No use, distribution or reproduction is permitted which does not comply with these terms.
*Correspondence: Surendra Singh Jatav, surendra.singh735@gmail.com