Article

Evolution of the Critically Endangered Green Sawfish Pristis zijsron (Rhinopristiformes, Pristidae), Inferred from the Whole Mitochondrial Genome

1
State Key Laboratory of Marine Environmental Science, College of Ocean and Earth Sciences, Xiamen University, Xiamen 361000, China
2
College of Marine Sciences, South China Agricultural University, Guangzhou 510642, China
3
CSIRO Environment, Boggo Road, Dutton Park, QLD 4102, Australia
4
Guangzhou Key Laboratory of Subtropical Biodiversity and Biomonitoring, School of Life Sciences, South China Normal University, Guangzhou 510631, China
5
CSIRO Environment, Castray Esplanade, Hobart, TAS 7000, Australia
*
Authors to whom correspondence should be addressed.
These authors contributed equally to this work.
Genes 2023, 14(11), 2052; https://doi.org/10.3390/genes14112052
Submission received: 29 September 2023 / Revised: 28 October 2023 / Accepted: 2 November 2023 / Published: 8 November 2023

Abstract

:
The green sawfish Pristis zijsron (Bleeker, 1851), a species of sawfish in the family Pristidae (Rhinopristiformes), mainly inhabits the Indo-West Pacific region. In this study, the complete mitochondrial genome of the critically endangered green sawfish is first described. The length of the genome is 16,804 bp, with a nucleotide composition of 32.0% A, 24.8% C, 13.1% G, and 30.0% T. It contains 37 genes in the typical gene order of fish. Two start (GTG and ATG) and two stop (TAG and TAA/T-) codons are found in the thirteen protein-coding genes. The 22 tRNA genes range from 67 bp (tRNA-Ser) to 75 bp (tRNA-Leu). The ratio of nonsynonymous substitution (Ka) and synonymous substitution (Ks) indicates that the family Pristidae are suffering a purifying selection. The reconstruction of Bayesian inference and the maximum likelihood phylogenetic tree show the same topological structure, and the family Pristidae is a monophyletic group with strong posterior probability. Pristis zijsron and P. pectinata form a sister group in the terminal clade. And the divergence time of Rhinopristiformes show that P. zijsron and P. pectinata diverged as two separate species in about Paleogene 31.53 Mya. Complete mitochondrial genomes of all five sawfishes have been published and phylogenetic relationships have been analyzed. The results of our study will provide base molecular information for subsequent research (e.g., distribution, conservation, phylogenetics, etc.) on this endangered group.

1. Introduction

Chondrichthyans (sharks, rays, and chimeras) are the most evolutionary distinct radiation of vertebrates, and the entire clade has been determined as one of the first major marine fish lineages facing extinction risk [1,2]. The genomic architecture of chondrichthyans may be closer to the ancestral vertebrate condition compared with scleractinians, but there is limited available research [3,4]. It is noteworthy that the life history traits (e.g., slow growth, low fecundity in long gestation boxes, etc.) of cartilaginous fishes make them more susceptible to overfishing problems compared with bony fishes [5]. Rhinopristiformes is an order of rays that have shark-like features, which is presumably a combination of Rhinobatiformes and Pristiformes, two nominal orders in which taxa had previously been placed, including at least 71 species in 12 genera [6,7]. This order is known by a few common names, such as guitarfish, giant guitarfish, sawfish, etc. The populations of many Rhinopristiformes species are declining in heavily fished areas, and are facing a high risk of extinction [8,9]. Therefore, more attention should be paid to this group.
Although sawfishes are similar to sharks, they are actually rays. The green sawfish Pristis zijsron (Bleeker, 1851) mainly inhabits the shallow waters of coastal marine, mangrove, or estuarine habitats of the Indo-West Pacific region [10,11]. And it is the largest sawfish species of family Pristidae, reaching an impressive length of up to 24 feet. In Australia, the distribution of green sawfish is from the east coast of the central Pacific Ocean, around the northern continent, to Shark Bay in the south-west to the eastern Indian Ocean, but the population in north-eastern Australia has now declined dramatically, and may even be extinct along much of the east coast of Australia [12,13,14]. On the contrary, the species is still regularly found in western Australia. Due to habitat destruction and modification, populations of sawfishes have been impacted worldwide [15,16]. The International Union for the Conservation of Nature and Natural Resources (IUCN) Red List of Threatened Species declared that the family Pristidae is the most threatened elasmobranch in the world because of their declining population numbers, and all international commercial trade of five sawfishes was prohibited by the Convention on International Trade in Endangered Species of Flora and Fauna (CITES) Appendix I [17,18]. In addition, four Pristis (dwarf sawfish P. clavate, smalltooth sawfish P. pectinata, largetooth sawfish P. pristis and green sawfish P. zijsron) are currently assessed as “Critically Endangered” under criteria A2cd [14,19,20,21], because of being highly vulnerable to entanglement in gillnets and demersal trawl nets. Although it has never been quantified, it is believed that P. zijsron is experiencing drastic reduction in population size across its range and no longer appears to be common anywhere in its range. In the last 50 years, it has no longer appeared to be common anywhere within its range, and it is possibly extinct in some countries, for example, China, Thailand, Singapore, etc. [14].
In general, mitochondria are thought to have originated from Alphaproteobacteria, through the process of endosymbiosis existing in eukaryotic cells [22,23]. The mitochondrial genome synthesizes proteins autonomously and participates in different physiological functions in organisms [24]. Fish mitochondrial DNA is a circular, covalently closed double-stranded DNA molecule of 15–20 kilobases (kb) in length, and is considered to have an evolutionary origin independent of nuclear DNA, generally comprising 13 protein-coding genes (PCGs), 22 transfer RNA genes (tRNAs), 2 ribosomal RNA genes (rRNAs), an open reading frame (OL), and a control region (CR) [25,26]. Moreover, the mitochondrial genome is often used as a reliable marker to study the origin and phylogenetic relationship of species due to its fast evolution rate, maternal inheritance, and small molecular weight. Although accurately identifying sawfish species is a difficult task, the mitochondrial DNA may provide a powerful tool for scientists who are not expert taxonomists [27,28]. Molecular data will greatly contribute to other related studies of sawfishes. Recently, Haque et al. used DNA barcoding (COI gene) to verify the recording of green sawfish P. zijsron in Bangladeshi waters [29]. And Aschliman et al. used 12 H-strand PCGs to explore batoid evolution [4].
Here, we add the first whole mitochondrial genomic sequence for P. zijsron, and use it to predict the phylogenetic position of the sawfish species. Furthermore, we investigate the divergence time of Rhinopristiformes using a dataset (12 H-strand PCGs and rRNAs) in conjunction with fossil records. It is believed that the study will provide important molecular data for subsequent studies on the distribution, conservation, and evolution of sawfish species.

2. Materials and Methods

2.1. Sample Collection and Sequence Analysis

The sample (fin clip) of P. zijsron was collected from a specimen captured and released at Cape Keraudren, Western Australia, Australia, on 14 April 2008. The specimen was a male measuring 260 cm total length. The tissue sample was stored at CSIRO, Castray Esplanade, Hobart, Tasmania, Australia, with voucher no. 1034 G. The genomic DNA was extracted from the fin clip by the standard phenol-chloroform procedure [30]. LA-PCR reactions were performed using the TakaraTM LA-Taq DNA polymerase kit. The PCR primers and PCR reaction conditions closely followed a previous study [31].
Sequence data were generated and analyzed to map the complete mitochondrial genome using the Lasergene soft package [32]. The species was identified by morphology and fragments of COI and 16S rRNA gene downloaded from National Center of Biotechnology Information (NCBI) (https://www.ncbi.nlm.nih.gov/genbank/, accessed on 1 September 2023). The mitochondrial genome was firstly annotated by MITOS2 Web Server [33]. The 22 tRNA genes’ secondary structures were determined by tRNAscan-SE Search Server v2.0 [34], then further confirmed with default search mode in ARWEN v1.2 [35]. Annotation and accurate boundary determination of PCGs and rRNAs genes were aligned and manually compared with the other released reference genomes of Pristidae species using DNAman v9.0 [36]. Tandem Repeats Finder was used to find tandem repeats in the non-coding regions (NCR), then secondary structures were identified by Mfold v3.5. [37].
The P. zijsron mitochondrial genome was drawn into a full circular genome using CGView Server v1.0 (Figure 1) [38]. The base compositions, codon usage, and relative synonymous codon usage (RSCU) values were calculated in MEGA X [39], then plotted using ggblot2 by Rstudio. Nucleotide diversity (Pi), non-synonymous substitutions (Ka), and synonymous substitution (Ks) mutation rate ratios of the PCGs of the Pristidae mitochondrial genome were calculated with Dnasp v6 [40]. The strand asymmetry was assessed using the formulas provided as below: AT skew was calculated as (A − T)/(A + T), and GC skew was calculated as (G − C)/(G + C) [41].

2.2. Phylogenetic Analysis

Phylogenetic analyses were performed using the new mitochondrial genome and other Rhinopristiformes species with complete mitochondrial genomes downloaded from GenBank (Table 1). Callorhinchus milii (NC_014285) and Tor putitora (NC_021755) were chosen as outgroups. The DNA sequences of 12 H-strand PCGs and rRNAs genes were firstly aligned using the MAFFT program, and were then re-aligned with MACSE v2 software [42,43]. And the alignments of H-strand PCGs (excluding the start, stop, and the third codon) were divided into the first and the second codon positions. Gblocks was employed to eliminate ambiguously aligned segments from the rRNA alignments [44]. The final dataset comprised the above segments after concatenation using Phylosuite v1.2.3 [45].
The three segments of the dataset were pre-defined as partitions and verified by PartitionFinder v2.1.1 [59], and the ModelFinder program was used to select the best-fit partition model [60]. The GTR+F+I+G4 model was selected as the best one and three partitions were defined: (1) two rRNA genes; (2) the first; and (3) the second codons of 12 PCGs. In addition, phylogenetic reconstruction was performed using the Bayesian analyses (BI) and Maximum Likelihood (ML) methods. ML analysis was inferred under 1,000,000 ultrafast bootstraps with an approximate Bayes test using IQ-TREE v1.6.2 [61]. Based on the above partition model, Bayesian inference was conducted using MrBayes 3.2.6 software, under partition model (2 parallel runs, 1 × 10⁶ generations), in which the initial 25% of sampled data were discarded as burn-in [62]. Subsequently, the tree files were employed for visualization and annotation by the Figtree program.

2.3. Divergence Time Analysis

Divergence times were calculated within a Bayesian framework using the aforementioned dataset and BEAST version 2.5 [63]. The uncorrelated lognormal relaxed clock, GTR substitution model, gamma site heterogeneity model, and the Yule process tree prior were selected to estimate differentiation time. Then, the divergence time analysis used three time calibration points derived from the TimeTree online [64]: 55.3 million years ago (Mya) for the common ancestor of P. clavata and P. pristis; 85.6 Mya for the common ancestor of the genera Rhina and Pristis; and 159.2 Mya for the common ancestor of Rhinopristiformes.
The chains of 1 × 10⁸ samples were run for the Markov chain Monte Carlo (MCMC) analysis, and 10% of all samples had burn-in using TreeAnnotator software. Tracer v1.7.1 was used to analyze the results [65]. Mean ages, along with 95% highest posterior density (HPD) intervals, posterior probabilities, and substitution rates, were computed for every node. The Figtree program was used to visualize the tree file.

3. Results and Discussion

3.1. Mitochondrial Genome Structure and Organization

The P. zijsron mitochondrial genome (GenBank accession No. MH005927) is 16,804 bp in length. The gene content of P. zijsron was similar to the typical fish mitochondrial genome, including 37 typical regions, 13 protein-coding (PCGs), 22 transfer RNA (tRNAs), 2 ribosomal RNA (rRNAs) genes, and 1 non-coding control region, with the typical gene order and transcriptional orientation of most vertebrate mitochondrial genomes (Figure 1 and Table 2). All genes were encoded on the heavy-strand (H-strand), except the ND6 and eight tRNA genes (Gln, Ala, Asn, Cys, Thr, Ser, Glu and Pro) located on the light-strand (L-strand). The size and location of each gene were also similar to most fish mitochondrial genomes.
There were 39 base pairs (bp) of short intergenic regions situated at 15 gene junctions, along with 24 bp overlaps identified at 6 gene junctions. Among all these intergenic regions, the shortest overlap was 10 bp in length (found between tRNA-Lys and ATP8), while the longest spacer was 6 bp in length (found between ATP8 and ATP6). In addition, the P. zijsron mitochondrial genome’s OL was positioned between the tRNA-Asn and tRNA-Cys gene, spanning a length of 33 bp. Furthermore, three tRNA genes (Ile, Gln, Met) and five tRNA genes (Trp, Ala, Asn, Cys, Tyr) were observed to form clusters typically referred to as the “IQM” and “WANCY” regions.
The nucleotide composition was 32.0% adenine (A), 24.8% cytosine (C), 13.1% guanine (G), and 30.0% thymine (T), respectively. The base skew was also measured. The AT-skews of the entire mitochondrial genome of P. zijsron were positive (indicating an excess of A content over T), while the GC-skews were negative, indicating a higher G content than C content. Additionally, the AT-skews of 12 H-strand PCGs genes were more positive than GC-skews. The results indicate the A content was higher than the T content, and the C content was higher than the G content for the P. zijsron mitochondrial genome (Figure 2). And the AT content of the complete P. zijsron mitochondrial genome was 62.0%, similar to four other published Pristidae mitochondrial genomes (Table 1) [31,47,48,49].

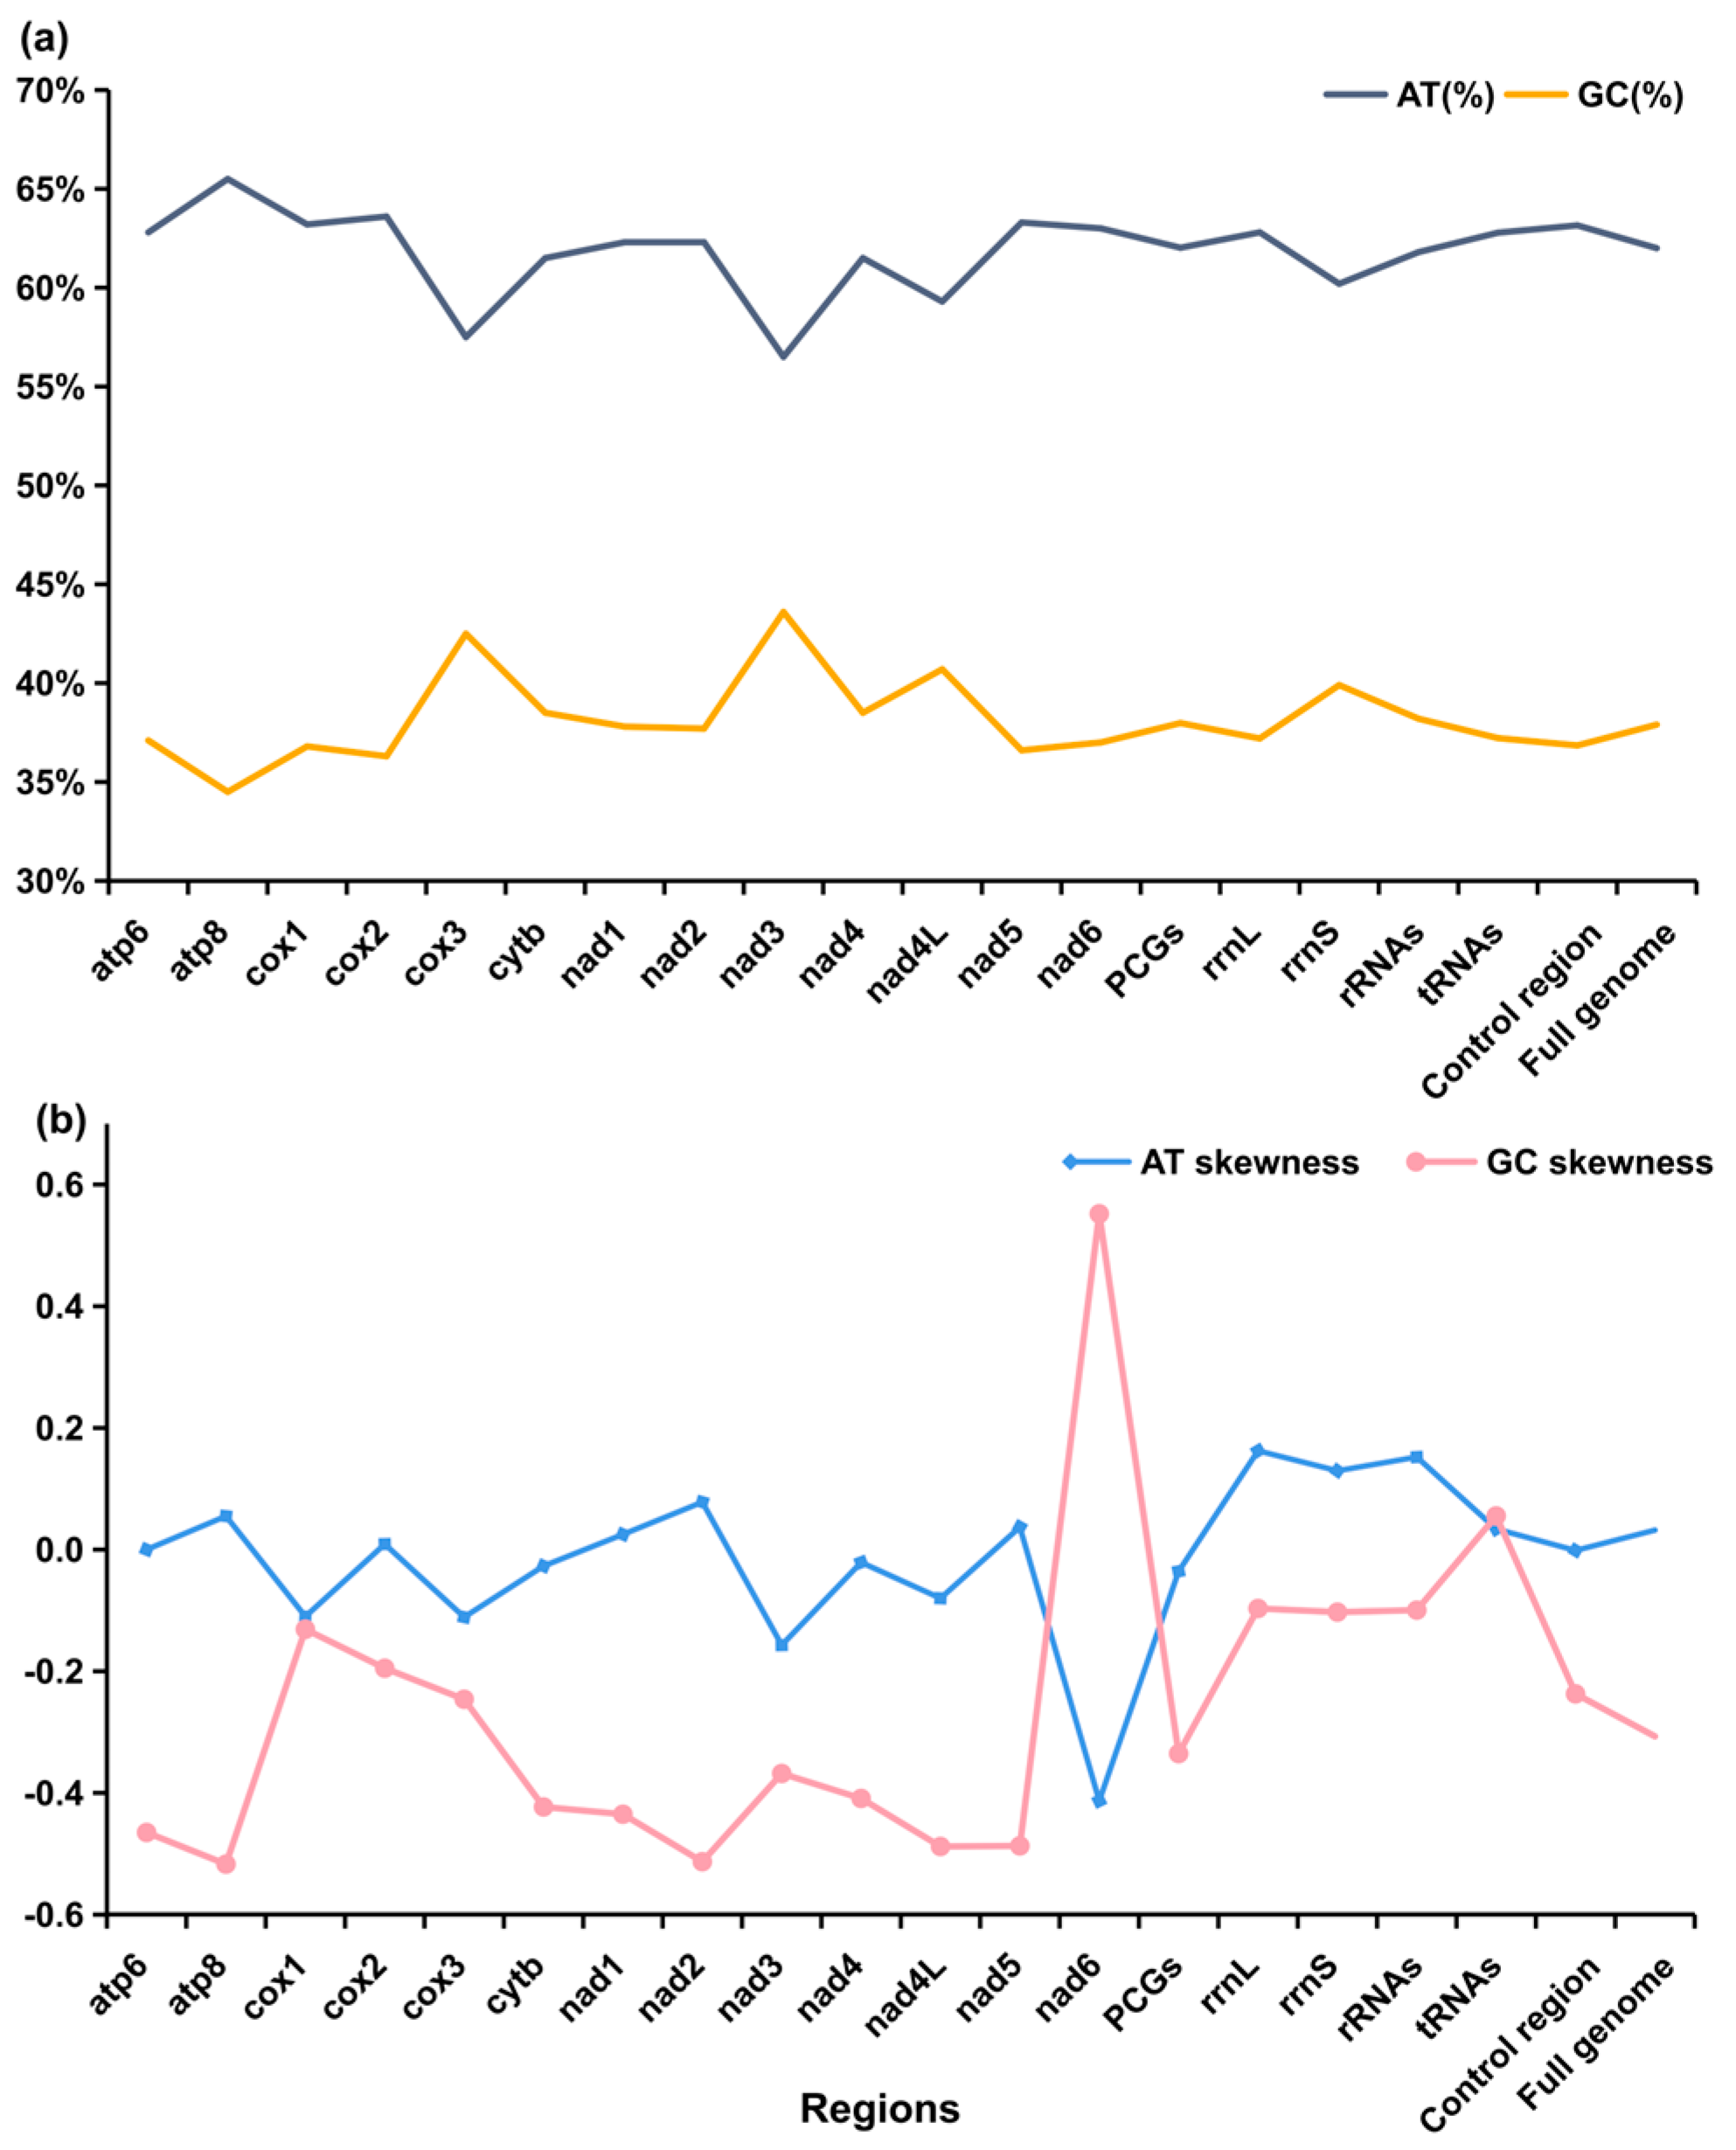
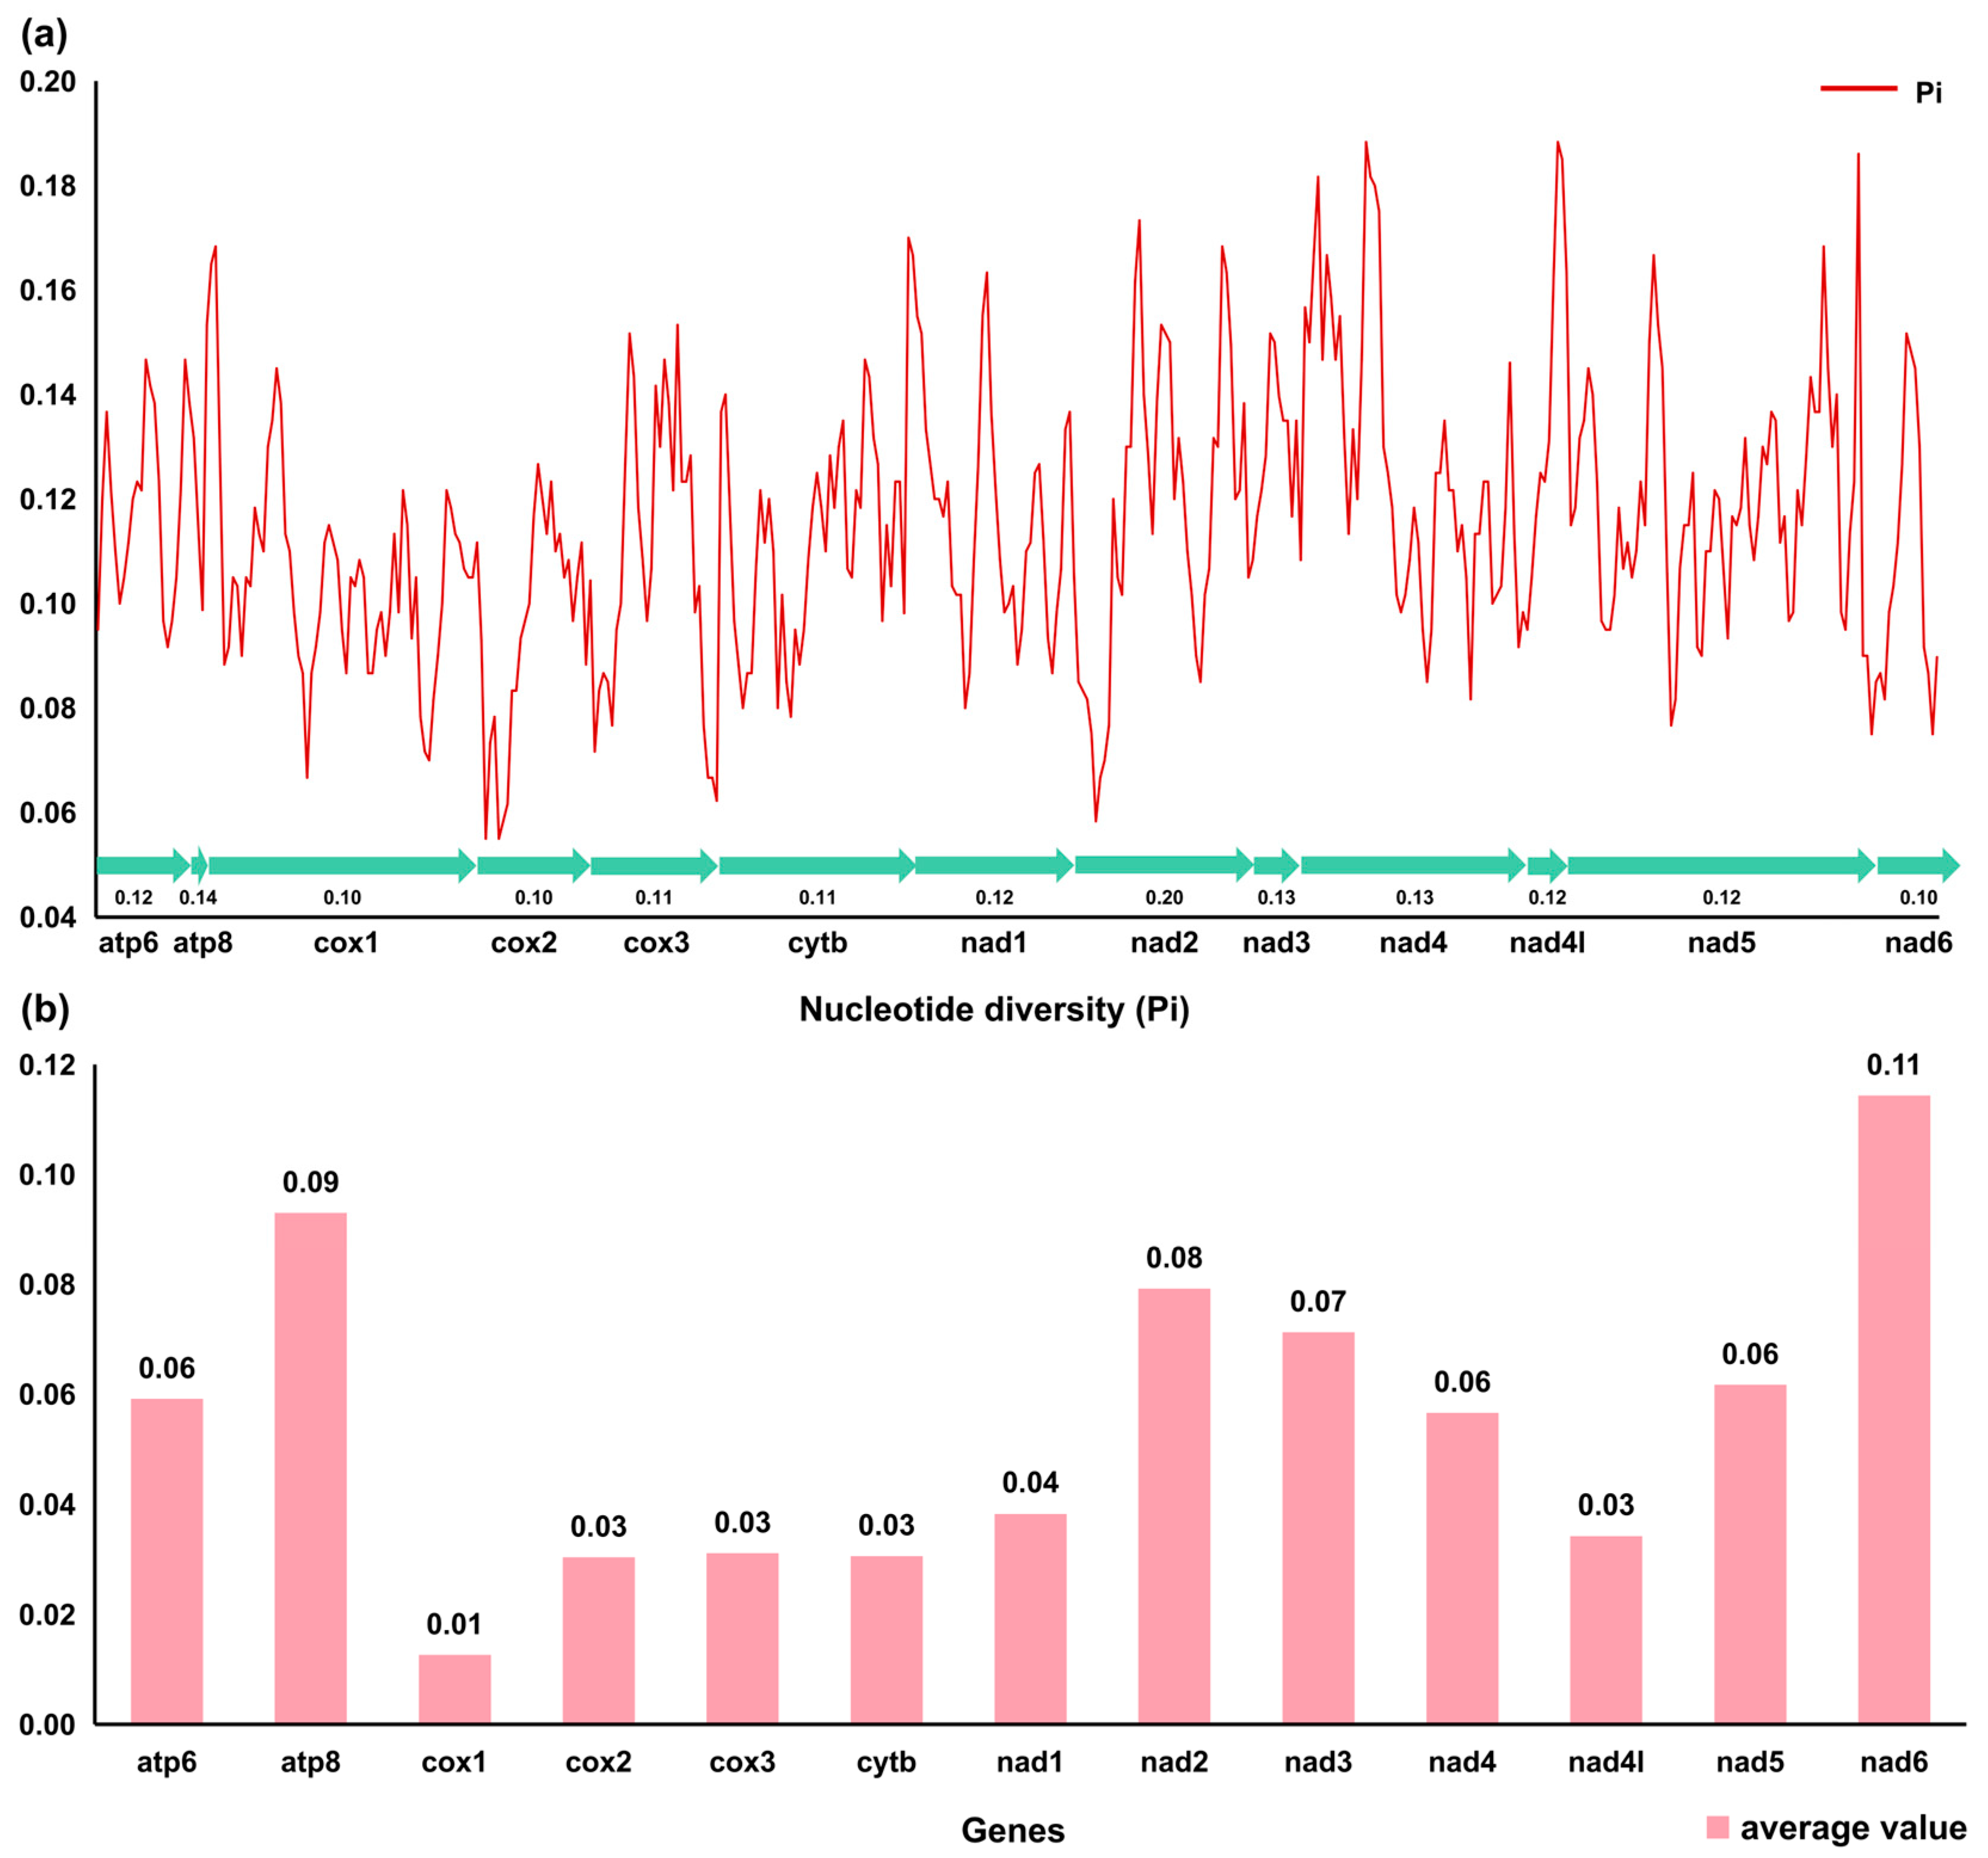
3.2. Protein Coding Genes and Codon Usage

The lengths of 13 PCGs range from 297 bp (ND4L gene) to 1839 bp (ND5 gene). The COI gene starts with a GTG codon, which is normal in fish mitochondrial genomes [66]. The remaining protein genes start with the conventional ATG codon. Except for the ND6 gene terminating with the TAG codon, the other genes ended with TAA/T- codons. The 12 H-strand PCGs were T-rich, whereas the ND6 gene encoded on the L-strand was A-rich (Figure 2).
The most frequent amino acids in the PCGs of P. zijsron mitochondrial genome proteins were Leucine (Leu) and I-isoleucine (Ile), similar to other published Pristidae mitochondrial sequences (Figure 3a). Moreover, Cysteine (Cys) was the least frequently utilized amino acid in the mitochondrial sequence of P. zijsron. Simultaneously, the relative synonymous codon usage (RSCU) values of the P. zijsron mitochondrial genome were computed and are presented in Figure 3b. The findings revealed a bias toward A and T in the third codons. The length, RSCU, skewness, and AT content of PCGs in the P. zijsron mitochondrial genome were nearly identical, similar to other published Pristidae sequences.
Four species of sawfishes were grouped in pairs and their Ka/Ks were calculated, as shown in Figure 4. The Ka/Ks ratios of the 13 PCGs in 4 Pristidae mitochondrial genomes were all much less than 1. The highest average Ka/Ks ratio (0.11) was found in the ND6 gene, and the lowest average ratio (0.01) was found in the COI gene. Therefore, it can be considered that the genes had undergone purifying selection, and the evolution tended to be conservative.

3.3. Transfer RNAs, Ribosomal RNAs, and the D-Loop

Like the typical set of tRNA genes in fish mitochondrial genomes, 22 standard tRNA genes were found, and most of them could be folded into the typical cloverleaf structure, except for tRNA-Ser gene lacking the entire dihydrouridine arm. It had two kinds of tRNA-Leu and tRNA-Ser (Table 2). The lengths of 22 tRNAs were varied, ranging from 67 bp (tRNA-Ser) to 75 bp (tRNA-Leu), and the AT content was larger than the GC content (Figure 2a).
The 12S rRNA (963 bp) and 16S rRNA (1695 bp) genes were located between the tRNA-Phe and tRNA-Leu genes, separated by a tRNA-Val gene. The two rRNAs, both encoded by the H-strand, indicated moderate nucleotide compositional bias towards AT content (Figure 2). Moreover, the AT-skew of rRNAs was strongly positive, whereas the GC-skew was slightly negative, so a higher A and C content compared with T and G content in these regions was indicated.
The non-coding regions in the P. zijsron mitochondrial genome include the control regions (CR), the origin of L-strand replication (OL), and several short intergenic spacers that range in size from 1 to 7 bp. The AT-rich CR, located between tRNA-Pro and tRNA-Phe with a length of 1110 bp, is the largest of these non-coding regions. The length of the CR is variable, and this is also the main reason for the differences in fish mitochondrial genome lengths. The CR of P. zijsron genomes showed positive AT-skew values. The origin of the L-strand replication sequence was identified between the tRNA-Asn and the tRNA-Cys genes. It was 33 bp in length and can be folded into a hairpin structure as a signal to initiate the replication of the L-strand.

3.4. Phylogenetic Inference

There is considerable attention being paid to the evolution of critically endangered sawfishes, and a robust phylogenetic analysis is essential for accurate research. For further investigation of the phylogenetic relationships of Rhinopristiformes, phylogenetic trees were constructed to compare with published complete mitochondrial genomes and two outgroups using the BI and ML methods. The two different approaches produced identical topologies with high nodal support values (Figure 5). Consistent with the traditional taxonomy, the phylogenetic reconstruction in this study strongly supported the monophyly of five families (Glaucostegidae+ Pristidae+ Rhinidae+ Rhinobatidae+ Rhynchobatidae) of Rhinopristiformes. Family Pristidae is farther from Rhinobatidae than other Rhinopristiformes.
The phylogeny of the family Pristidae is now fully resolved. All five species are clustered together with the four Pristis species (P. zijsron, P. pristis, P. clavate, and P. pectinata), forming a monophyletic group. Pristis zijsron and P. pectinata form a sister group in the terminal clade, then cluster with P. clavata and P. pristis. Anoxypristis cuspidata is placed in the basal position of the family Pristidae. Rhinopristiformes is a large taxa including at least 78 species [11], and some new species of this group have been discovered in recent years [67,68,69,70,71,72]. Hence, the whole mitochondrial genomes of more species need to be studied to further investigate the phylogenetic relationships of this taxa. Additional mitochondrial genomes of Rhinopristiformes can be supporting evidence for morphological identification, especially for critically endangered species, and it will be useful to substantiate the conclusion in future studies.

3.5. Divergence Time Analysis

Divergence time typically denotes the estimated moment when two species or organism groups diverged from a shared ancestor, initiating independent evolutionary paths. Few studies have attempted to use mitochondrial genomic data to explore the evolution of sawfishes. To provide a timeline of P. zijsron evolution, the divergence time estimation of Rhinopristiformes and other related species was conducted using the Bayesian approach (Figure 6). The results show that Rhinopristiformes diverged from two outgroups (C. milii and T. putitora) in the Jurassic, about 159.18 Mya. Within the order Rhinopristiformes, the family Rhinobatidae firstly diverged from other species in the Cretaceous, about 110.66 Mya. The common ancestor of the family Pristidae occurred in 76.82 Mya. Pristis pectinata and P. zijsron diverged as two separate species at about 31.53 Mya, as the most recently diverged species in TimeTree. Notably, the genus Pristis exhibited a divergence time dating back to 55.31 Mya, earlier than the fossil records of P. pectinatus (3.6–5.333 Mya) and P. pristis (5.333–11.608 Mya) [73,74]. Similar to a previous Batoidea study, the major groups of Rhinopristiformes are estimated to have separated during the Cretaceous period. Subsequently, from the Late Cretaceous to the Cenozoic era, different subgroups emerged within each branch.
However, it is important to note that the divergence time was estimated using temporal calibration points on TimeTree, due to the lack of sufficiently accurate fossil evidence. Estimates with calibration points may lead to biased results, so the divergence time results can only be used as a preliminary reference in this study. In future, it will be necessary to add a lot of molecular data to Rhinopristiformes species and associated fossil evidence to this group, which will be helpful in reconstructing a more detailed phylogenetic tree for estimating the divergence times. More molecular data on Chondrichthyes need to be added, and will be indispensable for subsequent morphological and evolutional studies of endangered species in Chondrichthyes.

4. Conclusions

We successfully identified and compared the complete mitochondrial genome of P. zijsron for the first time. The length of the P. zijsron mitochondrial genome was 16,804 bp. The ratio of Ka and Ks indicated that Pristidae underwent a purifying selection, while the ND6 gene showed the highest Ka/Ks values (<1). Identical topologies with strong nodal support were produced by both ML and BI approaches, showing that the family Pristidae formed a monophyletic group. And the divergence time of Rhinopristiformes showed that P. zijsron and P. pectinate formed a sister group, diverging in the Paleogene, 31.53 Mya.
Additionally, there are currently no conservation methods in place for the Pristidae family. The structure and variability of the fish mitochondrial genome are still unclear. A comprehensive comparative study using full mitochondrial genomic sequences will help enhance our comprehension of the evolution profile and phylogenetic placement in the family Pristidae. It is anticipated that this study will significantly contribute to the development of research related to the resources and conservation of sawfish species.

Author Contributions

Conceptualization, methodology, P.F.; software, formal analysis, validation, writing—original draft preparation, C.W.; writing—original draft preparation, writing—review and editing, P.Y.; investigation, resources, data curation, R.P.; visualization, supervision, X.C.; project administration, funding acquisition, J.W. All authors have read and agreed to the published version of the manuscript.

Funding

This study was funded by the China-ASEAN Maritime Cooperation Fund (CAMC-2018F) and the Marine Biodiversity Hub, a collaborative partnership supported through funding from the Australian Government’s National Environmental Science Program (NESP). The APC was funded by J.W.

Institutional Review Board Statement

The animal study protocol was approved by the Institutional Ethics Committee of South China Agriculture University (code: 2022G003; approval date: 11 April 2022).

Informed Consent Statement

Not applicable.

Data Availability Statement

The datasets generated and analyzed during the current study are available from the corresponding author on reasonable request.

Conflicts of Interest

The authors declare no conflict of interest.

References

  1. Dulvy, N.K.; Pacoureau, N.; Rigby, C.L.; Pollom, R.A.; Jabado, R.W.; Ebert, D.A.; Finucci, B.; Pollock, C.M.; Cheok, J.; Derrick, D.H.; et al. Overfishing drives over one-third of all sharks and rays toward a global extinction crisis. Curr. Biol. 2021, 31, 4773–4787.e4778. [Google Scholar] [CrossRef] [PubMed]
  2. Stein, R.W.; Mull, C.G.; Kuhn, T.S.; Aschliman, N.C.; Davidson, L.N.K.; Joy, J.B.; Smith, G.J.; Dulvy, N.K.; Mooers, A.O. Global priorities for conserving the evolutionary history of sharks, rays and chimaeras. Nat. Ecol. Evol. 2018, 2, 288–298. [Google Scholar] [CrossRef] [PubMed]
  3. Venkatesh, B.; Kirkness, E.F.; Loh, Y.H.; Halpern, A.L.; Lee, A.P.; Johnson, J.; Dandona, N.; Viswanathan, L.D.; Tay, A.; Venter, J.C.; et al. Survey sequencing and comparative analysis of the elephant shark (Callorhinchus milii) genome. PLoS. Biol. 2007, 5, e101. [Google Scholar] [CrossRef] [PubMed]
  4. Aschliman, N.C.; Nishida, M.; Miya, M.; Inoue, J.G.; Rosana, K.M.; Naylor, G.J. Body plan convergence in the evolution of skates and rays (Chondrichthyes: Batoidea). Mol. Phylogenet. Evol. 2012, 63, 28–42. [Google Scholar] [CrossRef]
  5. Van Staden, M.; Ebert, D.A.; da Silva, C.; van der Bester Merwe, A.E. Comparative analyses of the complete mitochondrial genomes of two southern African endemic guitarfish, Acroteriobatus annulatus and A. blochii. Int. J. Biol. Macromol. 2022, 223, 1094–1106. [Google Scholar] [CrossRef]
  6. Chan, P.P.; Lin, B.Y.; Mak, A.J.; Lowe, T.M. tRNAscan-SE 2.0: Improved detection and functional classification of transfer RNA genes. Nucleic Acids Res. 2021, 49, 9077–9096. [Google Scholar] [CrossRef]
  7. Scharpf, C.; Lazara, K.J. The ETYFish project. Rhinopristiformes. Am. Curr. 2021, 1–6. [Google Scholar]
  8. Last, P.R.; De Carvalho, M.R.; Naylor, G.J.P.; Séret, B.; Stehmann, M.F.W. Rays of the World; CSIRO Publishing: Clayton South, VIC, Australia, 2016; Volume 790. [Google Scholar]
  9. Patterson, H.M.; D’Alberto, B.M.; Carlson, J.K.; Pardo, S.A.; Simpfendorfer, C.A. Population productivity of shovelnose rays: Inferring the potential for recovery. PLoS ONE 2019, 14, e0225183. [Google Scholar] [CrossRef]
  10. Marichamy, R. On a large-sized green saw fish Pristis zijsron Bleeker landed at Port Blair, Andamans. J. Mar. Biol. Assoc. India 1969, 10, 394. [Google Scholar]
  11. Weigmann, S. Annotated checklist of the living sharks, batoids and chimaeras (Chondrichthyes) of the world, with a focus on biogeographical diversity. J. Fish Biol. 2016, 88, 837–1037. [Google Scholar] [CrossRef]
  12. Wueringer, B.E. Sawfish captures in the Queensland Shark Control Program, 1962 to 2016. Endanger Species Res. 2017, 34, 293–300. [Google Scholar] [CrossRef]
  13. Lear, K.O.; Fazeldean, T.; Bateman, R.L.; Inglebrecht, J.; Morgan, D.L. Growth and morphology of Critically Endangered green sawfish Pristis zijsron in globally important nursery habitats. Mar. Biol. 2023, 170, 70. [Google Scholar] [CrossRef]
  14. Harry, A.V.; Everett, B.; Faria, V.; Fordham, S.; Grant, M.I.; Haque, A.B.; Ho, H.; Jabado, R.W.; Jones, G.C.A.; Lear, K.O.; et al. Pristis zijsron. The IUCN Red List of Threatened Species 2022: E.T39393A58304631. Mar. Biol. 2022, 170, 70. [Google Scholar] [CrossRef]
  15. Dulvy, N.K.; Davidson, L.N.K.; Kyne, P.M.; Simpfendorfer, C.A.; Harrison, L.R.; Carlson, J.K.; Fordham, S.V. Ghosts of the coast: Global extinction risk and conservation of sawfishes. Aquat. Conserv. Mar. Freshw. Ecosyst. 2014, 26, 134–153. [Google Scholar] [CrossRef]
  16. Leeney, R.H. Are sawfishes still present in Mozambique? A baseline ecological study. PeerJ. 2017, 5, e2950. [Google Scholar] [CrossRef]
  17. Simpfendorfer, C.A. Pristis zijsron (errata version published in 2019). In The IUCN Red List of Threatened Species; IUCN: Gland, Switzerland, 2013; E.T39393A141792003. [Google Scholar]
  18. Harrison, L.R.; Dulvy, N.K.E. Sawfish: A Global Strategy for Conservation; IUCN Species Survival Commission’s Shark Specialist Group: Vancouver, BC, Canada, 2014. [Google Scholar]
  19. Grant, M.I.; Charles, R.; Fordham, S.; Harry, A.V.; Lear, K.O.; Morgan, D.L.; Phillips, N.M.; Simeon, B.; Wakhida, Y.; Wueringer, B.E. Pristis clavata. In The IUCN Red List of Threatened Species; IUCN: Gland, Switzerland, 2022; e.T39390A68641215. [Google Scholar] [CrossRef]
  20. Carlson, J.; Blanco-Parra, M.P.; Bonfil-Sanders, R.; Charles, R.; Charvet, P.; Chevis, M.; Dulvy, N.K.; Espinoza, M.; Faria, V.; Ferretti, F.; et al. Pristis pectinata. In The IUCN Red List of Threatened Species; IUCN: Gland, Switzerland, 2022; E.T18175A58298676. [Google Scholar] [CrossRef]
  21. Espinoza, M.; Bonfil-Sanders, R.; Carlson, J.; Charvet, P.; Chevis, M.; Dulvy, N.K.; Everett, B.; Faria, V.; Ferretti, F.; Fordham, S.; et al. Pristis pristis. In The IUCN Red List of Threatened Species; IUCN: Gland, Switzerland, 2022; E.T18584848A58336780. [Google Scholar] [CrossRef]
  22. Henze, K.; Martin, W. Evolutionary biology: Essence of mitochondria. Nature 2003, 426, 127–128. [Google Scholar] [CrossRef]
  23. Muñoz-Gómez, S.A.; Wideman, J.G.; Roger, A.J.; Slamovits, C.H. The Origin of Mitochondrial Cristae from Alphaproteobacteria. Mol. Biol. Evol. 2017, 34, 943–956. [Google Scholar] [CrossRef]
  24. McBride, H.M.; Neuspiel, M.; Wasiak, S. Mitochondria: More than just a powerhouse. Curr. Biol. 2006, 16, R551–R560. [Google Scholar] [CrossRef]
  25. Wolstenholme, D.R. Animal Mitochondrial DNA: Structure and Evolution. Int. Rev. Cytol. 1992, 141, 173–216. [Google Scholar]
  26. Boore, J.L. Animal mitochondrial genomes. Nucleic. Acids. Res. 1999, 27, 1767–1780. [Google Scholar] [CrossRef]
  27. Steinke, D.; Bernard, A.M.; Horn, R.L.; Hilton, P.; Hanner, R.; Shivji, M.S. DNA analysis of traded shark fins and mobulid gill plates reveals a high proportion of species of conservation concern. Sci. Rep. 2017, 7, 9505. [Google Scholar] [CrossRef] [PubMed]
  28. Holmes, B.H.; Steinke, D.; Ward, R.D. Identification of shark and ray fins using DNA barcoding. Fish. Res. 2009, 95, 280–288. [Google Scholar] [CrossRef]
  29. Haque, A.B.; Das, S.A. First confirmed record of the Critically Endangered green sawfish Pristis zijsron from Bangladeshi waters. J. Fish. Biol. 2019, 94, 200–203. [Google Scholar] [CrossRef] [PubMed]
  30. Sambrook, J.; Fritsch, E.F. Molecular Cloning. A Laboratory Manual; Cold Spring Harbor Laboratory Press: New York, NY, USA, 1989. [Google Scholar]
  31. Chen, X.; Kyne, P.M.; Pillans, R.D.; Feutry, P. Complete mitochondrial genome of the Endangered Narrow Sawfish Anoxypristis cuspidata (Rajiformes: Pristidae). Mitochondrial DNA A DNA Mapp. Seq. Anal. 2015, 27, 4172–4173. [Google Scholar] [CrossRef]
  32. Burland, T.G. DNASTAR’s Lasergene sequence analysis software. Methods. Mol. Biol. 2000, 132, 71–91. [Google Scholar]
  33. Bernt, M.; Donath, A.; Juhling, F.; Externbrink, F.; Florentz, C.; Fritzsch, G.; Putz, J.; Middendorf, M.; Stadler, P.F. MITOS: Improved de novo metazoan mitochondrial genome annotation. Mol. Phylogenet. Evol. 2013, 69, 313–319. [Google Scholar] [CrossRef]
  34. Lowe, T.M.; Chan, P.P. tRNAscan-SE On-line: Integrating search and context for analysis of transfer RNA genes. Nucleic. Acids. Res. 2016, 44, 54–57. [Google Scholar] [CrossRef]
  35. Laslett, D.; Canback, B. ARWEN: A program to detect tRNA genes in metazoan mitochondrial nucleotide sequences. Bioinformatics 2008, 24, 172–175. [Google Scholar] [CrossRef]
  36. Wang, W. The Molecular Detection of Corynespora Cassiicola on Cucumber by PCR Assay Using DNAman Software and NCBI. In Computer and Computing Technologies in Agriculture IX; IFIP Advances in Information and Communication Technology; Springer: Berlin/Heidelberg, Germany, 2016; pp. 248–258. [Google Scholar]
  37. Zuker, M. Mfold web server for nucleic acid folding and hybridization prediction. Nucleic. Acids. Res. 2003, 31, 3406–3415. [Google Scholar] [CrossRef]
  38. Grant, J.R.; Stothard, P. The CGView Server: A comparative genomics tool for circular genomes. Nucleic. Acids. Res. 2008, 36, W181–W184. [Google Scholar] [CrossRef]
  39. Kumar, S.; Stecher, G.; Li, M.; Knyaz, C.; Tamura, K. MEGA X: Molecular Evolutionary Genetics Analysis across Computing Platforms. Mol. Biol. Evol. 2018, 35, 1547–1549. [Google Scholar] [CrossRef] [PubMed]
  40. Rozas, J.; Ferrer-Mata, A.; Sanchez-DelBarrio, J.C.; Guirao-Rico, S.; Librado, P.; Ramos-Onsins, S.E.; Sanchez-Gracia, A. DnaSP 6: DNA Sequence Polymorphism Analysis of Large Data Sets. Mol. Biol. Evol. 2017, 34, 3299–3302. [Google Scholar] [CrossRef] [PubMed]
  41. Perna, N.T.; Kocher, T.D. Patterns of nucleotide composition at fourfold degenerate sites of animal mitochondrial genomes. J. Mol. Evol. 1995, 41, 353–358. [Google Scholar] [CrossRef]
  42. Katoh, K.; Standley, D.M. MAFFT multiple sequence alignment software version 7: Improvements in performance and usability. Mol. Biol. Evol. 2013, 30, 772–780. [Google Scholar] [CrossRef]
  43. Ranwez, V.; Douzery, E.J.P.; Cambon, C.; Chantret, N.; Delsuc, F. MACSE v2: Toolkit for the Alignment of Coding Sequences Accounting for Frameshifts and Stop Codons. Mol. Biol. Evol. 2018, 35, 2582–2584. [Google Scholar] [CrossRef] [PubMed]
  44. Talavera, G.; Castresana, J. Improvement of phylogenies after removing divergent and ambiguously aligned blocks from protein sequence alignments. Syst. Biol. 2007, 56, 564–577. [Google Scholar] [CrossRef] [PubMed]
  45. Zhang, D.; Gao, F.; Jakovlić, I.; Zou, H.; Zhang, J.; Li, W.X.; Wang, G.T. PhyloSuite: An integrated and scalable desktop platform for streamlined molecular sequence data management and evolutionary phylogenetics studies. Mol. Ecol. Resour. 2020, 20, 348–355. [Google Scholar] [CrossRef]
  46. Johri, S.; Fellows, S.R.; Solanki, J.; Busch, A.; Livingston, I.; Mora, M.F.; Tiwari, A.; Cantu, V.A.; Goodman, A.; Morris, M.M.; et al. Mitochondrial genome to aid species delimitation and effective conservation of the Sharpnose Guitarfish (Glaucostegus granulatus). Meta Gene 2020, 24, 100648. [Google Scholar] [CrossRef]
  47. Feutry, P.; Kyne, P.M.; Grewe, P.M.; Chen, X.; Liu, M. Whole mitogenome of the Endangered dwarf sawfish Pristis clavata (Rajiformes: Pristidae). Mitochondrial DNA 2015, 26, 329–330. [Google Scholar] [CrossRef]
  48. Chen, X.; Wiley, T.; Kyne, P.M.; Feutry, P. Complete mitochondrial genome of the Critically Endangered Smalltooth Sawfish Pristis pectinata (Rajiformes: Pristidae). Mitochondrial DNA A DNA Mapp. Seq. Anal. 2015, 27, 3331–3332. [Google Scholar] [CrossRef]
  49. Kyne, P.M.; Wang, J.-J.; Xiang, D.; Chen, X.; Feutry, P. The phylogenomic position of the Critically Endangered Largetooth Sawfish Pristis pristis (Rhinopristiformes, Pristidae), inferred from the complete mitochondrial genome. Mitochondrial DNA Part B Resour. 2018, 3, 970–971. [Google Scholar] [CrossRef] [PubMed]
  50. Si, R.; Chen, H.; Ai, W.; Chen, X.; Chen, S. Complete mitochondrial genome and the phylogenetic position of the Bowmouth guitarfish Rhina ancylostoma (Rajiformes, Rhinobatidae). Mitochondrial DNA B Resour. 2016, 1, 270–272. [Google Scholar] [CrossRef] [PubMed]
  51. Chen, X.; Ai, W.; Shi, X.; Gao, T. Mitochondrial genome of the ringstraked guitarfish Rhinobatos hynnicephalus (Elasmobranchii: Rajiformes). Mitochondrial DNA 2015, 26, 653–654. [Google Scholar] [CrossRef] [PubMed]
  52. Chen, X.; Ai, W.; Xiang, D.; Pan, L.; Shi, X. Complete mitogenome of the brown guitarfish Rhinobatos schlegelii (Rajiformes, Rhinobatidae). Mitochondrial DNA A DNA Mapp. Seq. Anal. 2016, 27, 310–311. [Google Scholar] [CrossRef] [PubMed]
  53. Castillo-Páez, A.; del Río-Portilla, M.A.; Oñate-González, E.; Rocha-Olivares, A. The mitochondrial genome of the banded guitarfish, Zapteryx exasperata (Jordan and Gilbert, 1880), possesses a non-coding duplication remnant region. Mitochondrial DNA 2014, 27, 1668–1670. [Google Scholar] [CrossRef]
  54. Si, R.; Ding, W.; Chen, H.; Chen, X.; Ai, W. Complete mitochondrial genome and the phylogenetic position of the White-spotted guitarfish Rhynchobatus australiae (Rajiformes, Rhinobatidae). Mitochondrial DNA B Resour. 2016, 1, 315–317. [Google Scholar] [CrossRef]
  55. Groeneveld, M.J.; Klein, J.D.; Bennett, R.H.; Bester-van der Merwe, A.E. Characterization of the complete mitochondrial genomes of two Critically Endangered wedgefishes: Rhynchobatus djiddensis and Rhynchobatus australiae. Mitochondrial DNA Part B Resour. 2023, 8, 352–358. [Google Scholar] [CrossRef]
  56. Johri, S.; Tiwari, A.; Kerr, E.N.; Dinsdale, E.A. Mitochondrial genome of the Smoothnose wedgefish Rhynchobatus laevis from the Western Indian Ocean. Mitochondrial DNA B Resour. 2020, 5, 2083–2084. [Google Scholar] [CrossRef]
  57. Inoue, J.G.; Miya, M.; Lam, K.; Tay, B.H.; Danks, J.A.; Bell, J.; Walker, T.I.; Venkatesh, B. Evolutionary origin and phylogeny of the modern holocephalans (Chondrichthyes: Chimaeriformes): A mitogenomic perspective. Mol. Biol. Evol. 2010, 27, 2576–2586. [Google Scholar] [CrossRef]
  58. Sati, J.; Goel, C.; Kumar, R.; Ali, S.; Patiyal, R.S.; Singh, V.K.; Sahoo, P.K.; Barat, A. Complete mitochondrial genome organization of Tor putitora. Mitochondrial DNA 2014, 25, 278–279. [Google Scholar] [CrossRef]
  59. Lanfear, R.; Frandsen, P.B.; Wright, A.M.; Senfeld, T.; Calcott, B. PartitionFinder 2: New Methods for Selecting Partitioned Models of Evolution for Molecular and Morphological Phylogenetic Analyses. Mol. Biol. Evol. 2017, 34, 772–773. [Google Scholar] [CrossRef] [PubMed]
  60. Kalyaanamoorthy, S.; Minh, B.Q.; Wong, T.K.F.; von Haeseler, A.; Jermiin, L.S. ModelFinder: Fast model selection for accurate phylogenetic estimates. Nat. Methods. 2017, 14, 587–589. [Google Scholar] [CrossRef] [PubMed]
  61. Minh, B.Q.; Schmidt, H.A.; Chernomor, O.; Schrempf, D.; Woodhams, M.D.; von Haeseler, A.; Lanfear, R. IQ-TREE 2: New Models and Efficient Methods for Phylogenetic Inference in the Genomic Era. Mol. Biol. Evol. 2020, 37, 1530–1534. [Google Scholar] [CrossRef] [PubMed]
  62. Ronquist, F.; Teslenko, M.; van der Mark, P.; Ayres, D.L.; Darling, A.; Hohna, S.; Larget, B.; Liu, L.; Suchard, M.A.; Huelsenbeck, J.P. MrBayes 3.2: Efficient Bayesian phylogenetic inference and model choice across a large model space. Syst. Biol. 2012, 61, 539–542. [Google Scholar] [CrossRef] [PubMed]
  63. Bouckaert, R.; Vaughan, T.G.; Barido-Sottani, J.; Duchene, S.; Fourment, M.; Gavryushkina, A.; Heled, J.; Jones, G.; Kuhnert, D.; De Maio, N.; et al. BEAST 2.5: An advanced software platform for Bayesian evolutionary analysis. PLoS Comput. Biol. 2019, 15, e1006650. [Google Scholar] [CrossRef] [PubMed]
  64. Kumar, S.; Stecher, G.; Suleski, M.; Hedges, S.B. TimeTree: A Resource for Timelines, Timetrees, and Divergence Times. Mol. Biol. Evol. 2017, 34, 1812–1819. [Google Scholar] [CrossRef]
  65. Rambaut, A.; Drummond, A.J.; Xie, D.; Baele, G.; Suchard, M.A. Posterior Summarization in Bayesian Phylogenetics Using Tracer 1.7. Syst. Biol. 2018, 67, 901–904. [Google Scholar] [CrossRef]
  66. Wang, C.; Chen, H.; Tian, S.; Yang, C.; Chen, X. Novel Gene Rearrangement and the Complete Mitochondrial Genome of Cynoglossus monopus: Insights into the Envolution of the Family Cynoglossidae (Pleuronectiformes). Int. J. Mol. Sci. 2020, 21, 6895. [Google Scholar] [CrossRef]
  67. Last, P.R.; Kyne, P.M.; Compagno, L.J. A new species of wedgefish Rhynchobatus cooki (Rhinopristiformes, Rhinidae) from the Indo-West Pacific. Zootaxa 2016, 4139, 233–247. [Google Scholar] [CrossRef]
  68. Ebert, D.A.; Gon, O. Rhinobatos austini n. sp., a new species of guitarfish (Rhinopristiformes: Rhinobatidae) from the Southwestern Indian Ocean. Zootaxa 2017, 4276, 204–214. [Google Scholar] [CrossRef]
  69. Habib, K.A.; Islam, M.J. Description of a new species of giant guitarfish, Glaucostegus younholeei sp. nov. (Rhinopristiformes: Glaucostegidae) from the northern Bay of Bengal, Bangladesh. Zootaxa 2021, 4995, 129–146. [Google Scholar] [CrossRef] [PubMed]
  70. White, W.T.; Last, P.R.; Naylor, G.J. Rhinobatos manai sp. nov., a new species of guitarfish (Rhinopristiformes: Rhinobatidae) from New Ireland, Papua New Guinea. Zootaxa 2016, 4175, 588–600. [Google Scholar] [CrossRef] [PubMed]
  71. Last, P.R.; Seret, B.; Naylor, G.J.P. Description of Rhinobatos ranongensis sp. nov. (Rhinopristiformes: Rhinobatidae) from the Andaman Sea and Bay of Bengal with a review of its northern Indian Ocean congeners. Zootaxa 2019, 4576, zootaxa-4576. [Google Scholar] [CrossRef] [PubMed]
  72. Last, P.R.; Séret, B.; Naylor, G.J. A new species of guitarfish, Rhinobatos borneensis sp. nov. with a redefinition of the family-level classification in the order Rhinopristiformes (Chondrichthyes: Batoidea). Zootaxa 2016, 4117, 451–475. [Google Scholar] [CrossRef]
  73. Boaz, N.; El-Arnauti, A.; Gaziry, A.W.; Heinzelin, J.; Boaz, D. Neogene Paleontology and Geology of Sahabi, Libya; Alan R. Liss., Inc.: New York, NY, USA, 1987; pp. 145–151. [Google Scholar]
  74. Laurito, C.A. Los Selaceos Fósiles de Ia Localidad de Alto Guayacan (y Otros Ictiolitos Asociados); Texto Comunicación S.A.: San José, Costa Rica, 1999; p. 168. [Google Scholar]
Figure 1. Circular representation of the mitochondrial genome of Pristis zijsron.
Genes 14 02052 g001
Figure 2. Visual representation showing the base composition (a) and skewness (b) in the mitochondrial genome of Pristis zijsron.
Genes 14 02052 g002
Figure 3. The codon distribution (a) and relative synonymous codon usage (b) in Pristis zijsron mitochondrial genome.
Genes 14 02052 g003
Figure 4. Graphical illustration showing the sliding window analysis based on 13 PCGs of Pristidae mitochondrial genomes (a). The red line represents the value of nucleotide diversity observed in the sliding window analysis (window size = 100 bp, step size = 25 bp). The graph displays gene names and corresponding Pi values, while the arrows indicate the length of the 13 PCGs. Additionally, it illustrates the non-synonymous (Ka) to synonymous (Ks) substitution rates for 13 PCGs within the Pristidae family (b).
Genes 14 02052 g004
Figure 5. Mitogenomic phylogeny of Rhinopristiformes and two outgroups based on 12 H-strand PCGs and rRNA genes using the ML and BI methods.
Genes 14 02052 g005
Figure 6. Divergence time of Rhinopristiformes and two outgroups based on 12 H-strand PCGs and rRNA genes using BEAST2 software.
Genes 14 02052 g006
Table 1. Rhinopristiformes species information used in this study.
FamilySpeciesLength (bp)AT%GenBank IDReference
GlaucostegidaeGlaucostegus granulatus16,54759.8MN783017[46]
PristidaeAnoxypristis cuspidata17,243 61.3 NC_026307[31]
Pristis clavata16,804 60.2 NC_022821[47]
Pristis pectinata16,802 61.0 NC_027182[48]
Pristis pristis16,912 60.3 NC_039438[49]
Pristis zijsron16,804 62.0 MH005927This study
RhinidaeRhina ancylostoma17,217 62.3 NC_030215[50]
RhinobatidaeAcroteriobatus annulatus16,77359.8NC_068897[5]
Acroteriobatus blochii16,77160.1NC_068898[5]
Rhinobatos hynnicephalus16,77659.8NC_022841[51]
Rhinobatos schlegelii16,78060.4NC_023951[52]
Zapteryx exasperata17,31062.5NC_024937[53]
RhynchobatidaeRhynchobatus australiae16,80459.8NC_030254[54]
Rhynchobatus djiddensis16,79960.0NC_066688[55]
Rhynchobatus laevis16,56059.5NC_047241[56]
OutgroupCallorhinchus milii16,76966.2NC_014285[57]
Tor putitora16,57657.0NC_021755[58]
Table 2. Summary of gene features of Pristis zijsron mitochondrial genome.
RegionStrandPositionSize (bp)Start CodonStop CodonIntergenic Spacer
tRNA-Phe (F)H1–6969 0
12S rRNAH70–1032963 0
tRNA-Val (V)H1033–110573 0
16S rRNAH1106–27991695 0
tRNA-Leu (L)H2800–287475 0
ND1H2875–3849975ATGTAA2
tRNA-Ile (I)H3852–392170 −1
tRNA-Gln (Q)L3921–399272 0
tRNA-Met (M)H3993–406270 0
ND2H4063–51091047ATGTAA−1
tRNA-Trp (W)H5109–517769 2
tRNA-Ala (A)L5180–524869 0
tRNA-Asn (N)L5249–532173 0
OL-5322–535433 0
tRNA-Cys (C)L5355–542369 0
tRNA-Tyr (Y)L5424–549370 1
COIH5495–70511557GTGTAA 4
tRNA-Ser (S)L7056–712671 1
tRNA-Asp (D)H7128–719568 6
COIIH7202–7892691ATGT-0
tRNA-Lys (K)H7893–796674 1
ATP8H7968–8135168ATGTAA−10
ATP6H8126–8809684ATGTAA6
COIIIH8816–9601786ATGTAA1
tRNA-Gly (G)H9603–967270 0
ND3H9673–10,021349ATGT-1
tRNA-Arg (R)H10,023–10,09270 1
ND4LH10,094–10,390297ATG TAA −7
ND4H10,384–11,7641381ATGT-0
tRNA-His (H)H11,765–11,83369 0
tRNA-Ser (S)H11,834–11,90067 −1
tRNA-Leu (L)H11,900–11,97172 0
ND5H11,972–13,8101839ATGTAA−4
ND6L13,807–14,325519ATGTAG1
tRNA-Glu (E)L14,327–14,39569 3
CytbH14,399–15,5411143ATGTAA4
tRNA-Thr (T)H15,546–15,61974 5
tRNA-Pro (P)L15,625–15,69470 0
Control region-15,695–16,8041110 0
Disclaimer/Publisher’s Note: The statements, opinions and data contained in all publications are solely those of the individual author(s) and contributor(s) and not of MDPI and/or the editor(s). MDPI and/or the editor(s) disclaim responsibility for any injury to people or property resulting from any ideas, methods, instructions or products referred to in the content.

