Energy
Animation: The World’s Biggest Wind Turbines
![]() Subscribe to the Elements free mailing list for more like this
Subscribe to the Elements free mailing list for more like this
The World’s Biggest Wind Turbines
This was originally posted on Elements. Sign up to the free mailing list to get beautiful visualizations on natural resource megatrends in your email every week.
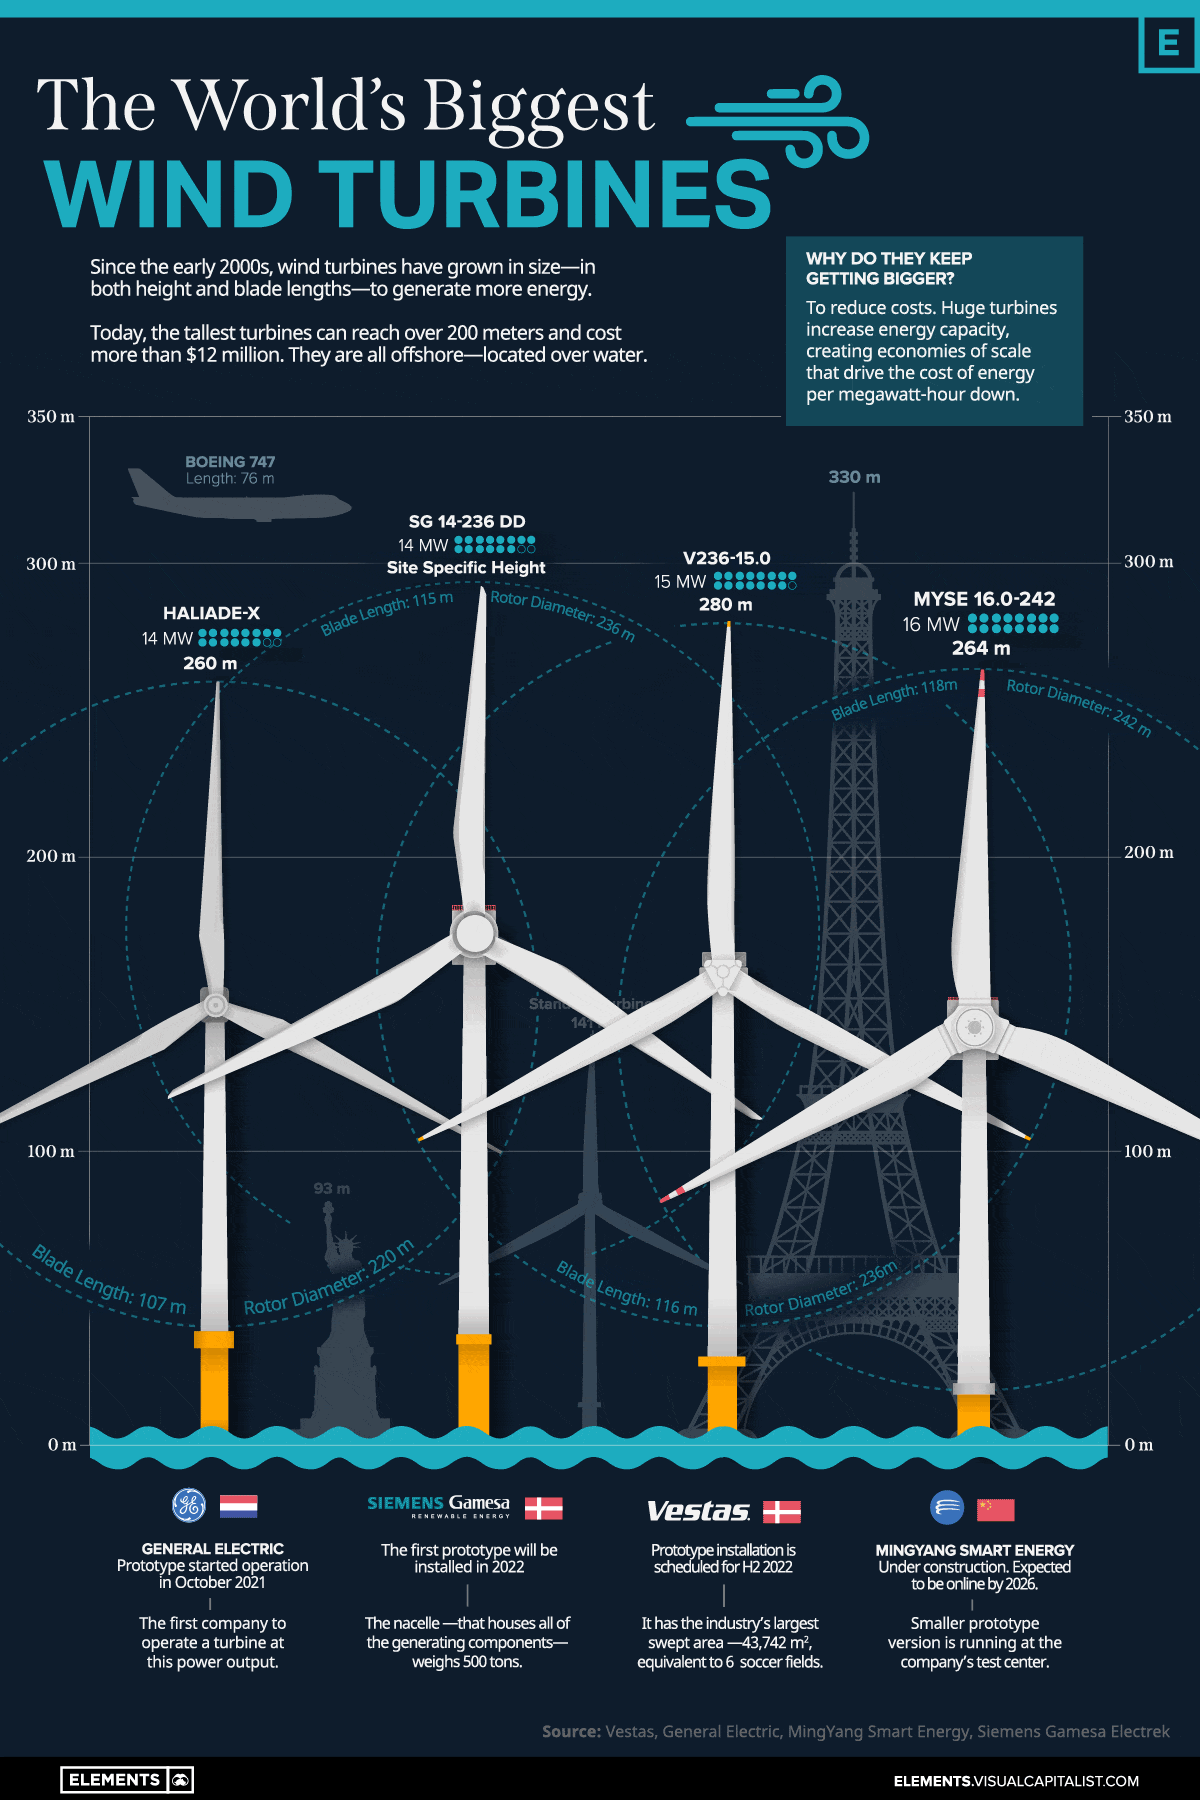
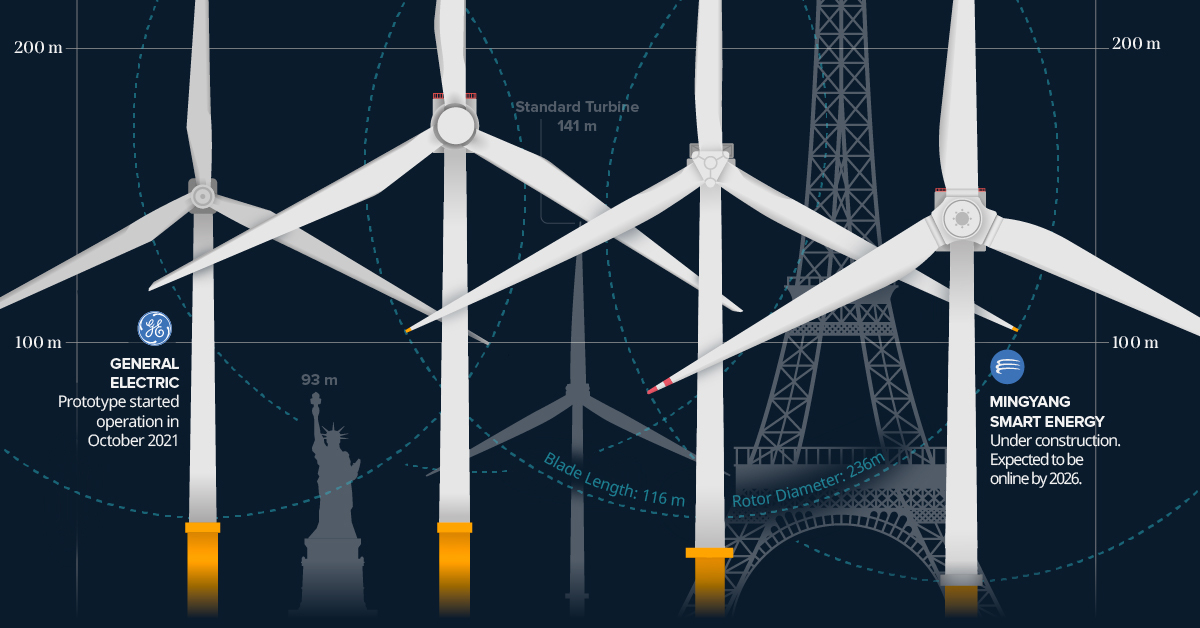
Since the early 2000s, wind turbines have grown in size—in both height and blade lengths—to generate more energy per unit.
Today, the tallest turbines can reach over 200 meters (650 ft) in height and cost more than $12 million to manufacture and install.
The above infographic uses data compiled from company portfolios to showcase the biggest wind turbines currently being developed and to put these huge structures into perspective.
Blade Runners
The biggest turbines are all located over water. The so-called offshore turbines can be taller than those onshore, which means they can harness more wind energy and produce more electricity.
MingYang Smart Energy, a Chinese wind turbine manufacturer, is in the process of building the biggest wind turbine so far.
Their new MySE 16.0-242 model is still under construction and is expected to be online by 2026. It will be 264 meters tall, with a blade length 118 meters long and rotor diameter of 242 meters. It features a nameplate capacity of 16 megawatts that can power 20,000 homes per unit over a 25-year service life. The first commercial turbine will be installed at the MingYang Yangjiang Qingzhou Four offshore wind farm, which is in the South China Sea.
Here are four of the biggest wind turbine models on the market right now, the companies that are making them, and where the prototypes are being installed:
| Model | Company | Nameplate capacity (MW) | Location | Height (m) | Blade Length (m) | Rotor Diameter (m) |
|---|---|---|---|---|---|---|
| MySE 16.0-242 | MingYang Smart Energy | 16 MW | 🇨🇳 | 264 | 118 | 242 |
| SG 14-236 DD | Siemens Gamesa | 14 MW | 🇩🇰 | Site Specific | 115 | 236 |
| Haliade-X | General Electric | 14 MW | 🇳🇱 | 260 | 107 | 220 |
| V236-15.0 | Vestas | 15 MW | 🇩🇰 | 280 | 116 | 236 |
These huge structures can be two times taller than a typical turbine currently in operation, generating almost four times more energy.
Prototypes for two of the top four turbine models—the SG 14-236 DD and V236-15.0— are scheduled to be installed in 2022 in Denmark, a country that was a pioneer in developing commercial wind power during the 1970s, and is home to the world’s largest wind-turbine manufacturer, Vestas.
From our list, General Electric’s Haliade-X is the only turbine currently online; the prototype has been operating since October 2021 in the Netherlands.
Wind Energy’s Rapid Global Growth
Wind generated 6.6% of the world’s electricity in 2021, up from 3.5% in 2015, when the Paris Agreement was signed, making it the fastest-growing source of electricity after solar.
A number of countries have achieved relatively high levels of wind energy penetration in their electricity grids.
Wind’s share of electricity generation was nearly 50% in Denmark and sits above 25% in countries such as Ireland, Uruguay, and Portugal. In the United States, wind supplied 8.4% of total electricity generation.
| Country | Wind Share of Electricity (%) |
|---|---|
| 🇩🇰 Denmark | 48% |
| 🇺🇾 Uruguay | 43% |
| 🇮🇪 Ireland | 33% |
| 🇵🇹 Portugal | 27% |
| 🇪🇸 Spain | 23% |
| 🇬🇧 United Kingdom | 21% |
| 🇩🇪 Germany | 20% |
| 🇬🇷 Greece | 20% |
| 🇰🇪 Kenya | 16% |
| 🇸🇪 Sweden | 16% |
Source: Ember’s Global Electricity Review 2022
Note: Countries with populations fewer than 3 million in 2021 were not included in this ranking.
The global wind turbine market size was valued at $53.4 billion in 2020 and is projected to reach $98.4 billion by 2030, growing at a CAGR of 6.3%.
As one of the fastest-growing segments of the energy sector, wind energy generation will continue to grow as wind turbines also scale up in size.


Energy
Mapped: The Age of Energy Projects in Interconnection Queues, by State
This map shows how many energy projects are in interconnection queues by state and how long these projects have been queued up, on average.


Age of Energy Projects in Interconnection Queues, by State
This was originally posted on our Voronoi app. Download the app for free on iOS or Android and discover incredible data-driven charts from a variety of trusted sources.
By the end of 2023, more than 11,000 energy projects were in interconnection queues in the United States, waiting for a green-light from regional grid operators to proceed with construction.
This map, created in partnership with the National Public Utilities Council, maps out the average age of active energy projects in interconnection queues by state, using data from Berkeley Lab.
Interconnection Queues, Explained
Interconnection queues are lists of energy projects that have made interconnection requests to their regional grid operators. Once submitted, these requests formally initiate the impact study process that each project goes through before grid connection, forming waiting lists for approval known as interconnection queues.
In recent years, both the number and generation capacity of queued projects have surged in the United States, along with the length of time spent in queue.
According to Berkeley Lab, the amount of generation capacity entering queues each year has risen by more than 550% from 2015 to 2023, with average queue duration rising from 3 years to 5 years the same period.
As a result of the growing backlog, a large proportion of projects ultimately withdraw from queues, leading to only 19% of applications reaching commercial operations.
The Backlog: Number of Projects and Average Wait Times
Of the 11,000 active projects in U.S. queues at the end of 2023, Texas, California, and Virginia had the most in queue; 1,208, 947, and 743, respectively.
When looking at the average ages of these projects, all three states hovered around the national average of 34 months (2.83 years), with Texas sporting 28 months, California 33, and Virginia 34.
Vermont, Minnesota, Wisconsin, and Florida, on the other hand, had the highest average queue durations; 54, 49, 47, and 46 months, respectively.
Average Queue Duration by Project Type
At the end of 2023, more than 95% of the generation capacity in active interconnection queues was for emission-free resources. The table below provides a breakdown.
| Project Type | Average Queue Duration (As of 12/31/2023) | Number of Projects in Queue |
|---|---|---|
| Wind | 40 months | 841 |
| Solar | 34 months | 4,506 |
| Wind+Battery | 34 months | 76 |
| Solar+Battery | 27 months | 2,377 |
| Battery | 24 months | 2,818 |
Wind projects had the highest wait times at the end of 2023 with an average age of 40 months (3.33 years). Solar projects, on the other hand, made up more than 40% of projects in queue.
Overall, reducing the time that these renewable energy projects spend in queues can accelerate the transition to a low-carbon energy future.
According to the U.S. Department of Energy, enhancing data transparency, streamlining approval processes, promoting economic efficiency, and maintaining a reliable grid are some of the ways this growing backlog can be mitigated.

-

 Technology6 days ago
All of the Grants Given by the U.S. CHIPS Act
-

 Uranium2 weeks ago
The World’s Biggest Nuclear Energy Producers
-

 Education2 weeks ago
How Hard Is It to Get Into an Ivy League School?
-

 Debt2 weeks ago
How Debt-to-GDP Ratios Have Changed Since 2000
-

 Sports2 weeks ago
The Highest Earning Athletes in Seven Professional Sports
-

 Science2 weeks ago
Visualizing the Average Lifespans of Mammals
-

 Brands1 week ago
How Tech Logos Have Evolved Over Time
-

 Energy1 week ago
Ranked: The Top 10 EV Battery Manufacturers in 2023